Hi all, anyone for a chart?
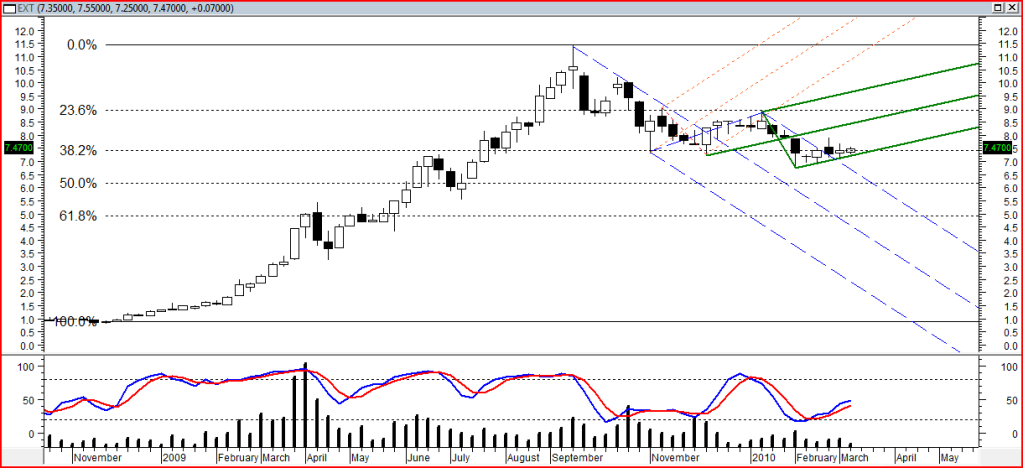
This is a weekly candlestick chart with Fibonnaci lines that originate from EXT's sub $1 days up to its all time high.
It is very clear that they key Fib retracement lines have provided a framework for the prices to find support and resistance.
There have been a few pitchforks guiding the price, the most recent being the slightly uptrending solid green fork.
Weekly stochastic can go more, but doesn't have to. (It doesn't always have to be overbought to turn down.)
I think that in order to get back that feeling of invincibility you all once had, the price needs to get back above the 23.6% line.
Cheers,
10cents

- Forums
- ASX - By Stock
- all quiet on the western front
EXT
excite technology services ltd
Add to My Watchlist
12.5%
 !
0.9¢
Hi all, anyone for a chart?This is a weekly candlestick chart...
Featured News
Add to My Watchlist
What is My Watchlist?
A personalised tool to help users track selected stocks. Delivering real-time notifications on price updates, announcements, and performance stats on each to help make informed investment decisions.
 (20min delay) (20min delay)
|
|||||
|
Last
0.9¢ |
Change
0.001(12.5%) |
Mkt cap ! $18.65M | |||
| Open | High | Low | Value | Volume |
| 0.9¢ | 0.9¢ | 0.9¢ | $1.044K | 115.9K |
Buyers (Bids)
| No. | Vol. | Price($) |
|---|---|---|
| 3 | 404545 | 0.8¢ |
Sellers (Offers)
| Price($) | Vol. | No. |
|---|---|---|
| 0.9¢ | 4382301 | 2 |
View Market Depth
| No. | Vol. | Price($) |
|---|---|---|
| 3 | 404545 | 0.008 |
| 7 | 5298700 | 0.007 |
| 5 | 4516666 | 0.006 |
| 2 | 1280000 | 0.005 |
| 2 | 1498000 | 0.004 |
| Price($) | Vol. | No. |
|---|---|---|
| 0.009 | 4382301 | 2 |
| 0.010 | 2793222 | 3 |
| 0.011 | 4166701 | 8 |
| 0.012 | 1482124 | 5 |
| 0.013 | 314500 | 2 |
| Last trade - 15.04pm 23/06/2025 (20 minute delay) ? |
Featured News
| EXT (ASX) Chart |


