Chart request by sunburntland:
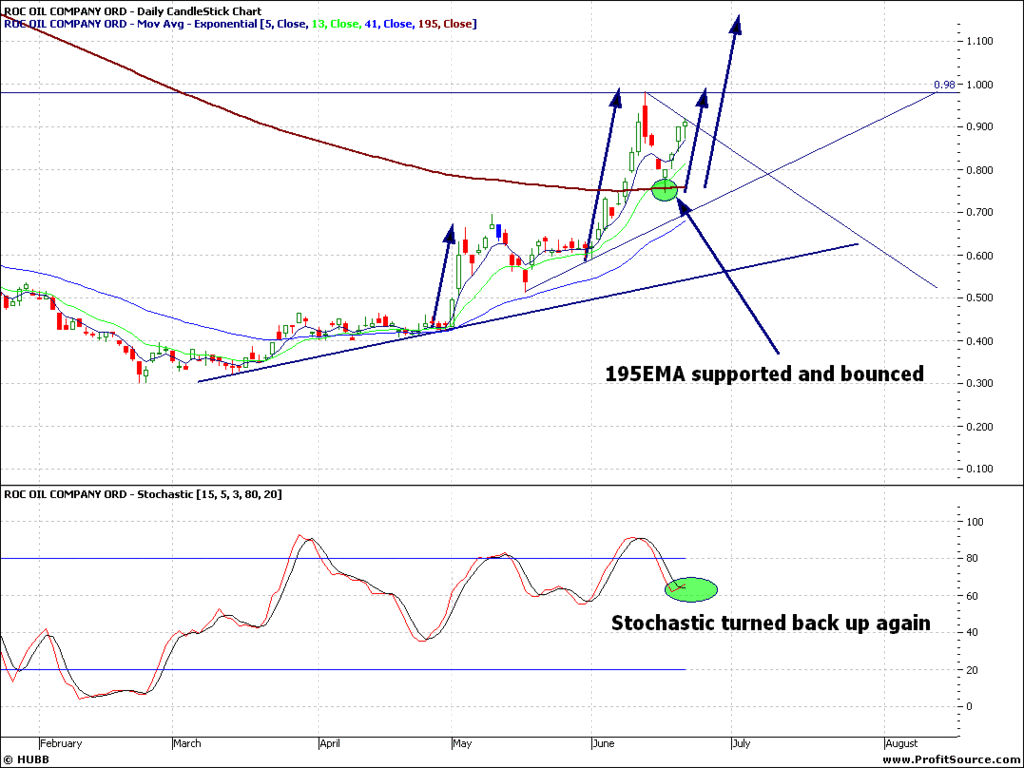
Daily:
Here you can see a few speed angles that may play out. To me it was an obvious sell on the blowoff top day when it got near a dollar, stochastic was very high, and it had run hard. Would have been a nice rebuy on the 195EMA. Stochastic has turned, and we could see a return back to 98, or the most bullish senario short term we could see over $1.1 .
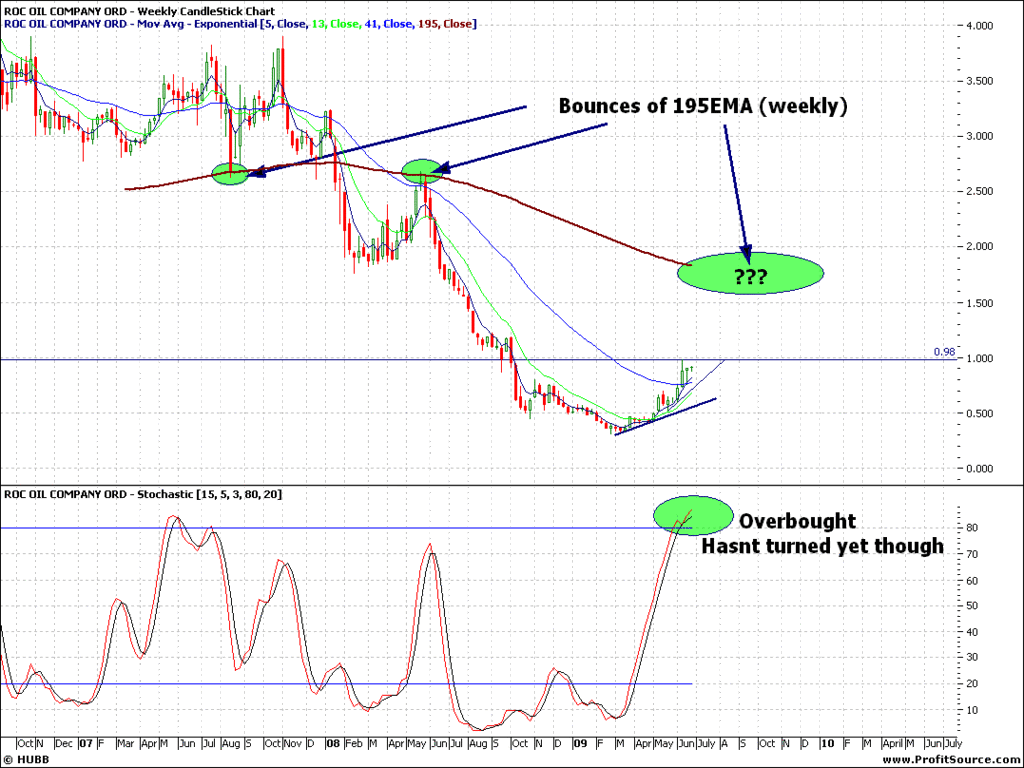
Weekly:
However, looking at the weekly, we see an overbought chart. Stochastics have not turned yet though. You could think LONG term it could reach targets of over $1.50 again, (see monthly chart). Reason is the 195EMA weekly line has acted as resistance and support in the past, and would make sence for it to rally up to it again sometime in the future... it just depends how high the 195EMA is at the time.
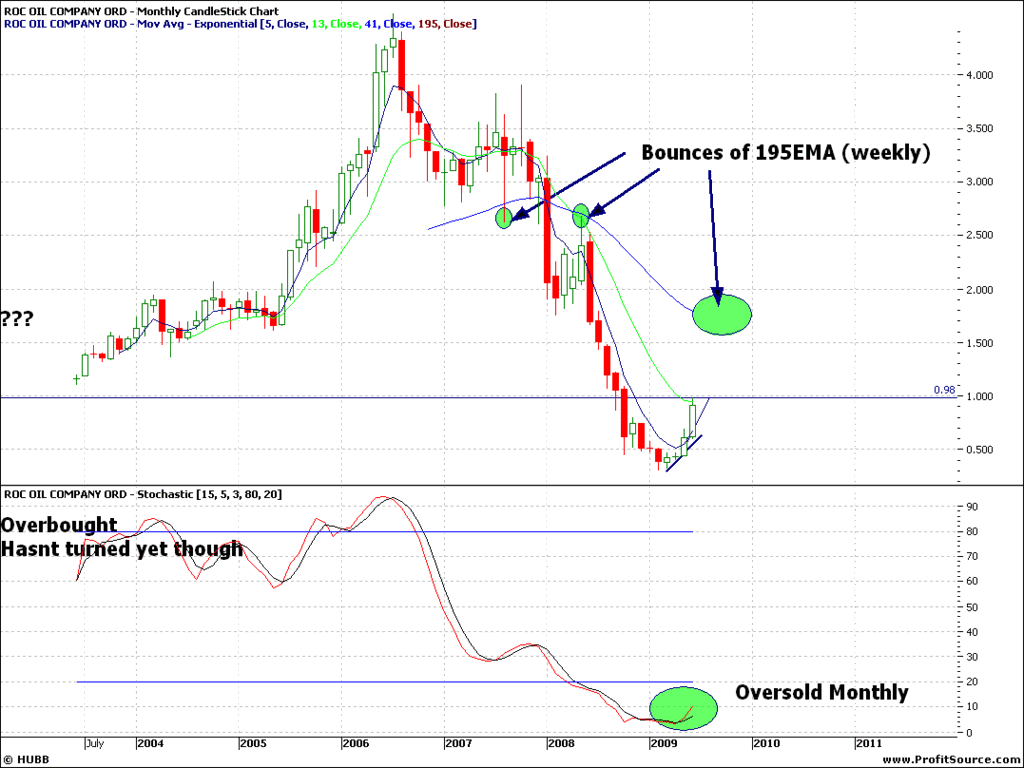
Monthly:
Here you can see the Monthly Stochastic is well oversold. This is the chart that supports targets over 1.5$ in the future. However, this is for long term investors only, or people who have held from the top and are willing to wait, expect alot of ups and downs till then.
- Forums
- ASX - By Stock
- ROC
- chart
chart
-
- There are more pages in this discussion • 1 more message in this thread...
You’re viewing a single post only. To view the entire thread just sign in or Join Now (FREE)
Featured News
Add ROC (ASX) to my watchlist
 (20min delay) (20min delay)
|
|||||
|
Last
10.5¢ |
Change
0.000(0.00%) |
Mkt cap ! $8.525M | |||
| Open | High | Low | Value | Volume |
| 0.0¢ | 0.0¢ | 0.0¢ | $0 | 0 |
Featured News
| ROC (ASX) Chart |
Day chart unavailable


