Thanks Esh, I own 50% of your list, the below is from a much longer article from Marin Katusa that I found very interesting so thought I'd share.
Here's the link
https://katusaresearch.com/introduc...gold-investors-katusas-gold-per-share-metric/
Essentially looking at gold companies gold reserves versus outstanding shares. By measuring this on an ongoing basis you can see if the management is growing the companys assets / reserves per outstanding shares, or if we're being diluted either via issuance of new shares (capital raising) or delpetion of exisiting reserves.
What is important is a company’s GPS trend.
As gold investor, you want to see a company’s Gold Per Share increase, not decrease. A decrease in GPS means you own less gold per share than you did previously.
Instead, we want to own companies that increase gold reserves without diluting shareholders.
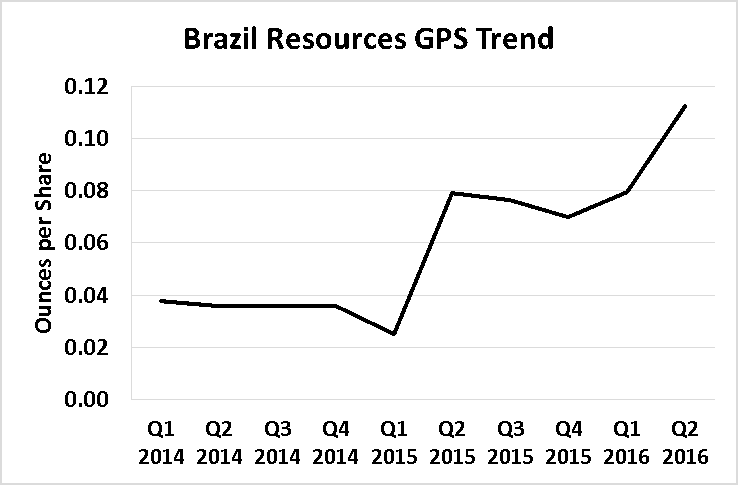
We typically look at a company’s GPS in chart form. We want to see an uptrend in GPS.
For example, one gold company I like, Brazil Resources, increased GPS from .038 in early 2014 to 0.11 in early 2016. That’s 192% “gold growth.” It produces the kind of uptrend we like to see:
Believe it or not, even most supposed “smart money” institutional investors don’t look at gold companies this way. They simply look for growth, whether it is creating long-term value for shareholders or not.
I want to own growing gold companies, but I want to see intelligent growth that is creating long-term value for shareholders.
Our Gold Per Share metric is the ultimate tool for finding companies that are growing intelligently…while avoiding serial diluters who make their shareholders poorer, in terms of gold, every year.
If you truly want to make money in gold stocks, you’ll never buy another one without carefully reviewing its Gold Per Share trend.
Thanks Esh, I own 50% of your list, the below is from a much...


Add NST (ASX) to my watchlist
 (20min delay) (20min delay)
|
|||||
|
Last
$16.21 |
Change
-0.030(0.18%) |
Mkt cap ! $18.58B | |||
| Open | High | Low | Value | Volume |
| $16.21 | $16.26 | $16.10 | $26.78M | 1.662M |
Buyers (Bids)
| No. | Vol. | Price($) |
|---|---|---|
| 6 | 4096 | $16.21 |
Sellers (Offers)
| Price($) | Vol. | No. |
|---|---|---|
| $16.22 | 7029 | 13 |
View Market Depth
| Last trade - 12.04pm 27/09/2024 (20 minute delay) ? |
| NST (ASX) Chart |