Look at these stunning images of panic from this week’s brutal selloff.
Selling on Thursday generated at least a couple readings of panic
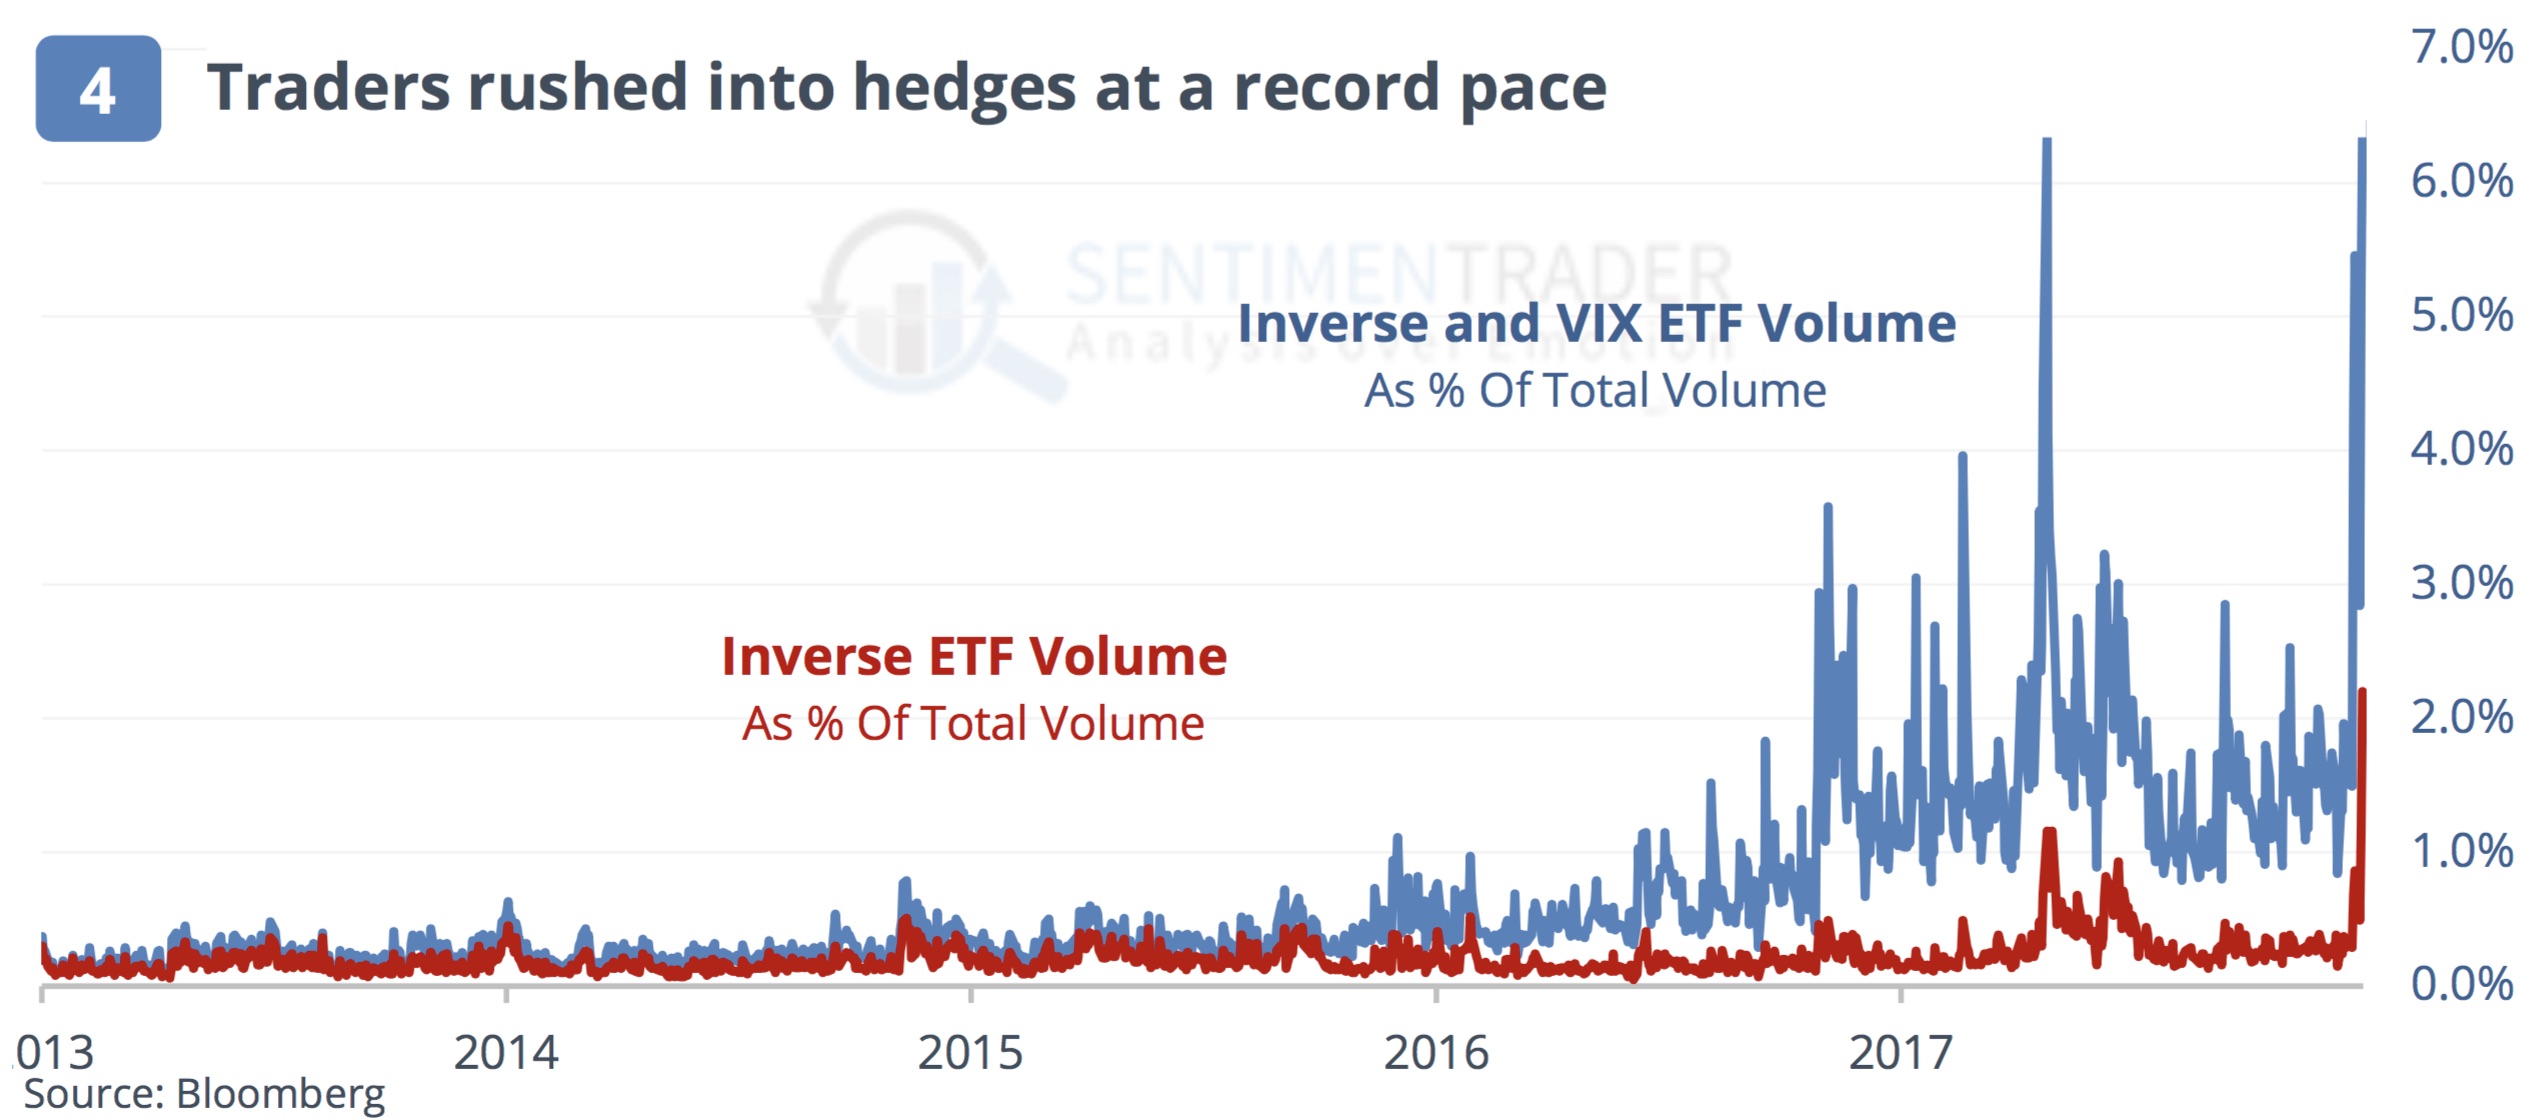
October 12 (King World News) – Here is a portion of today’s note from Jason Goepfert at SentimenTrader: Inverse ETF volume exploded, as program selling reached multi-year highs. When the indexes broke their early morning lows and selling pressure picked up, it reached a crescendo that hasn’t often been matched. Never, in some cases…
Jason Goepfert continues: For the first time in history, volume in inverse ETFs neared 2% of total NYSE volume, almost double the prior record from February. That’s remarkable.If we include volatility ETFs in the equation, then it exceeded 6% of NYSE volume, also a record, but just barely eclipsing February when the volatility products were a much bigger deal. (see chart below).
First Panic Reading…
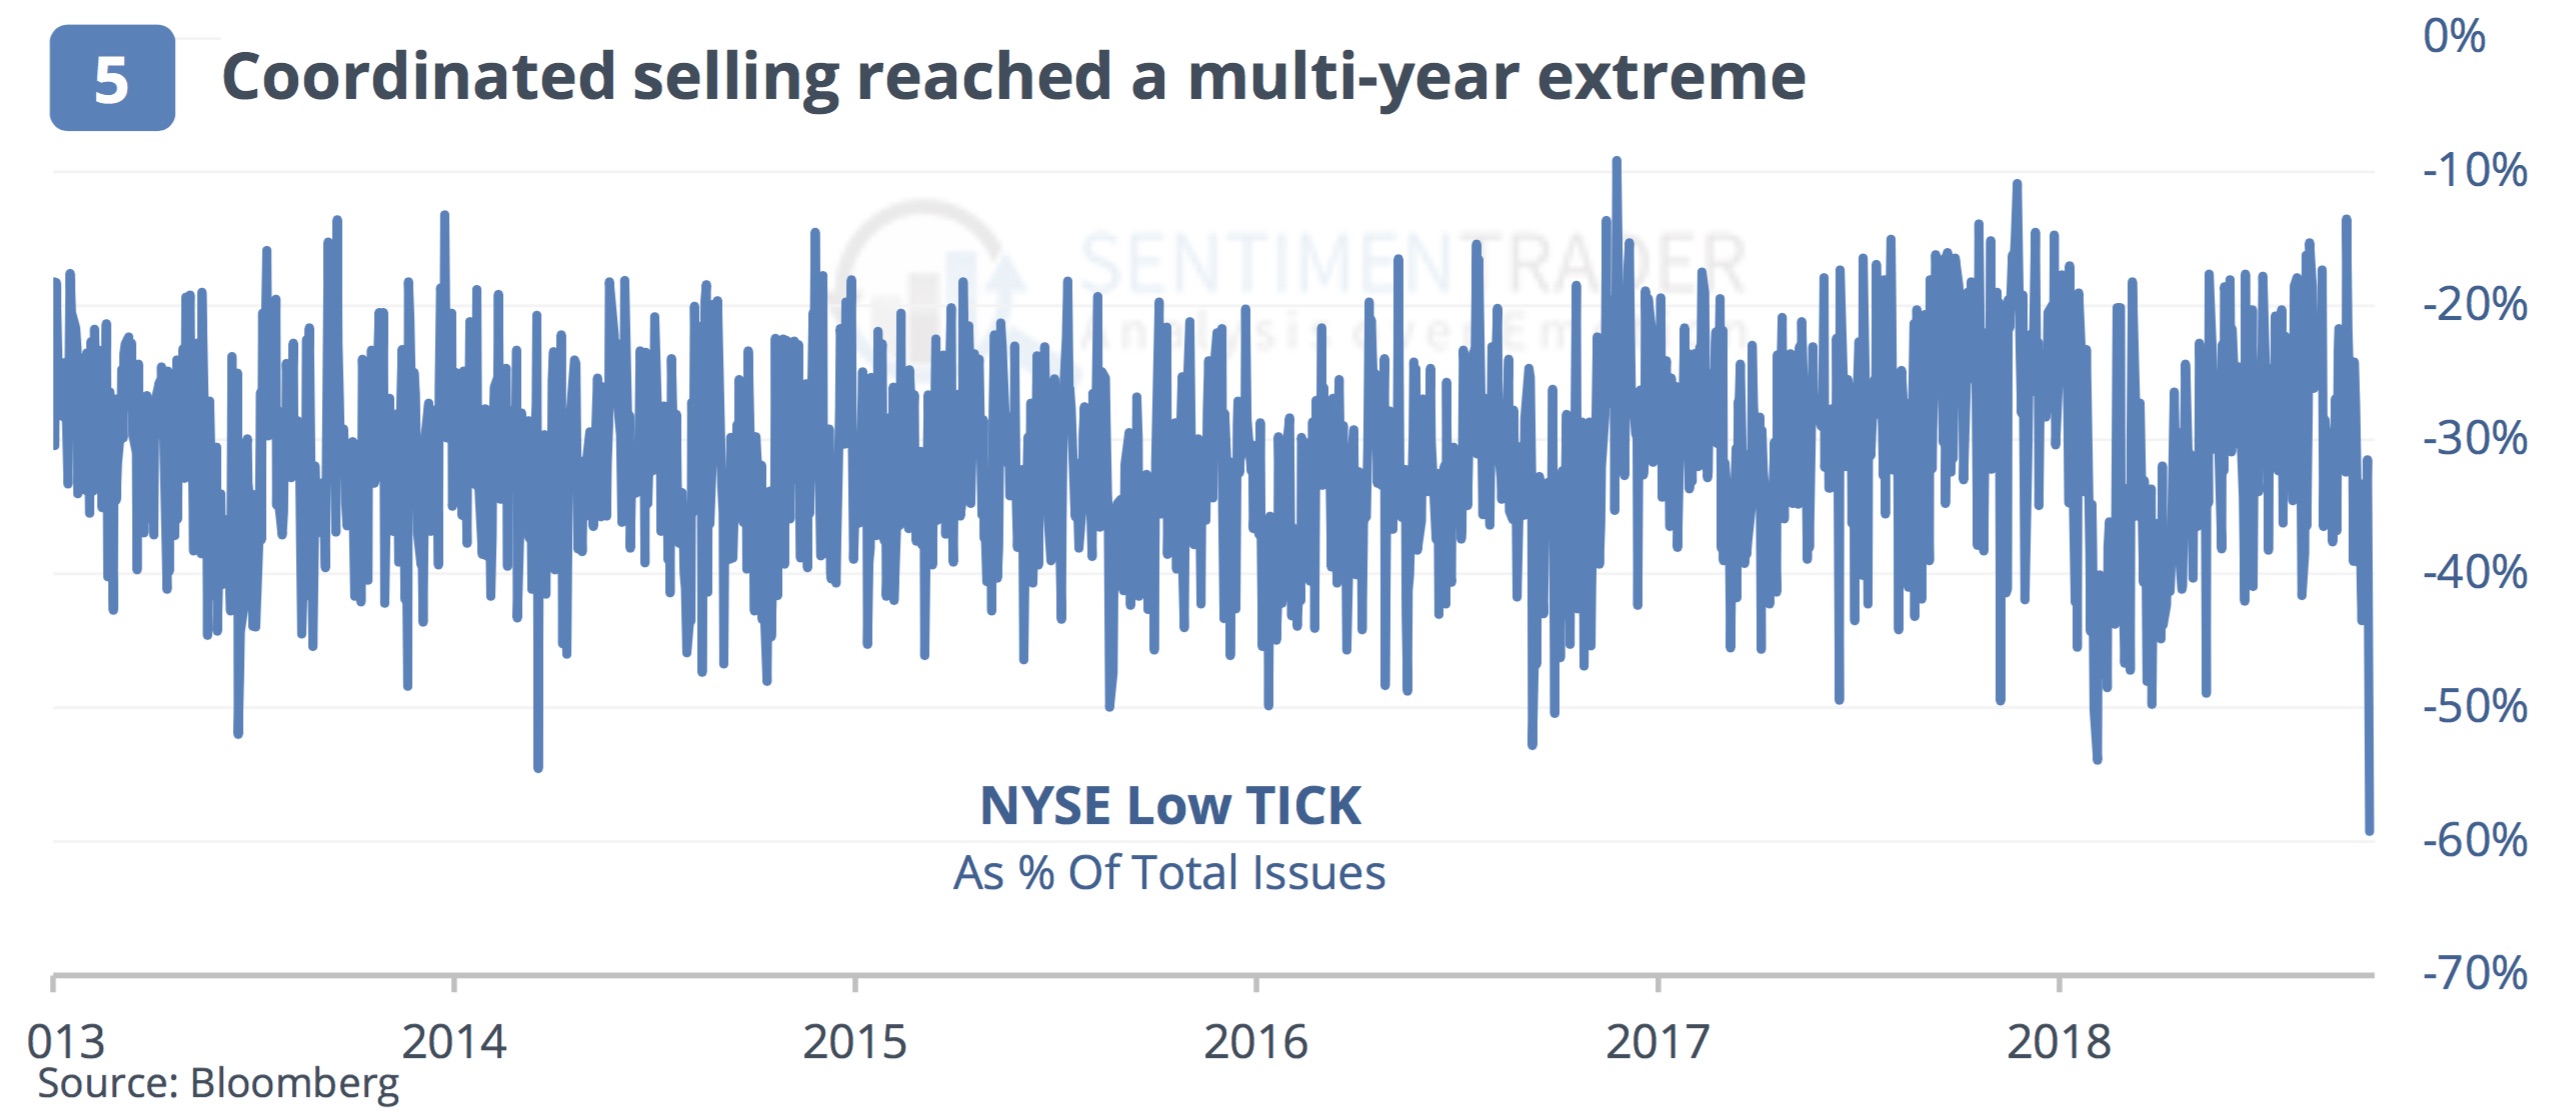
At the worst point on Thursday, nearly 60% of the NYSE was ticking lower, the worst since 2011(see chart below).
Second Panic Reading…
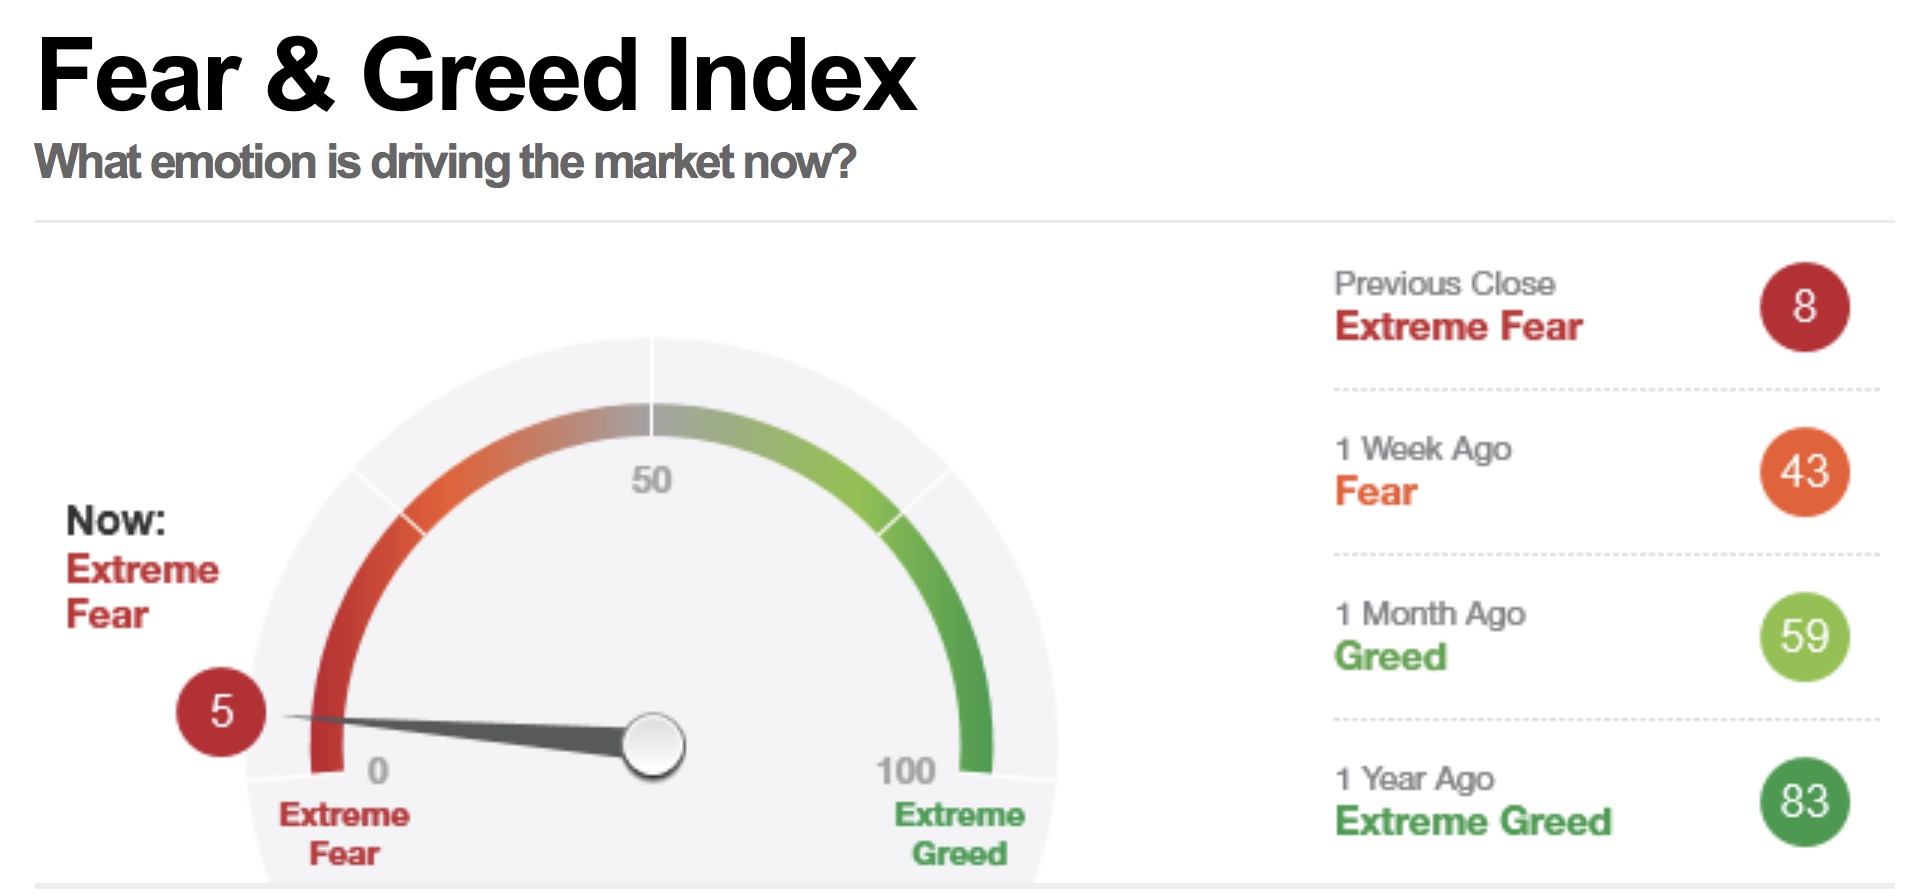
The CNN Fear & Greed proxy model fell even further, now below 8. We don’t see that very often, even during bear markets (see below).
EXTREME FEAR: Fear & Greed Index Hit 5 Yesterday!
There is much more to this special report from SentimenTrader but it is only available to subscribers. To subscribe or try a free two week trial to the internationally acclaimed work that Jason Goepfert produces at SentimenTrader CLICK HERE.
What could go wrong???


Add to My Watchlist
What is My Watchlist?
