Look at these stunning images of panic from this week’s brutal selloff.
Selling on Thursday generated at least a couple readings of panic
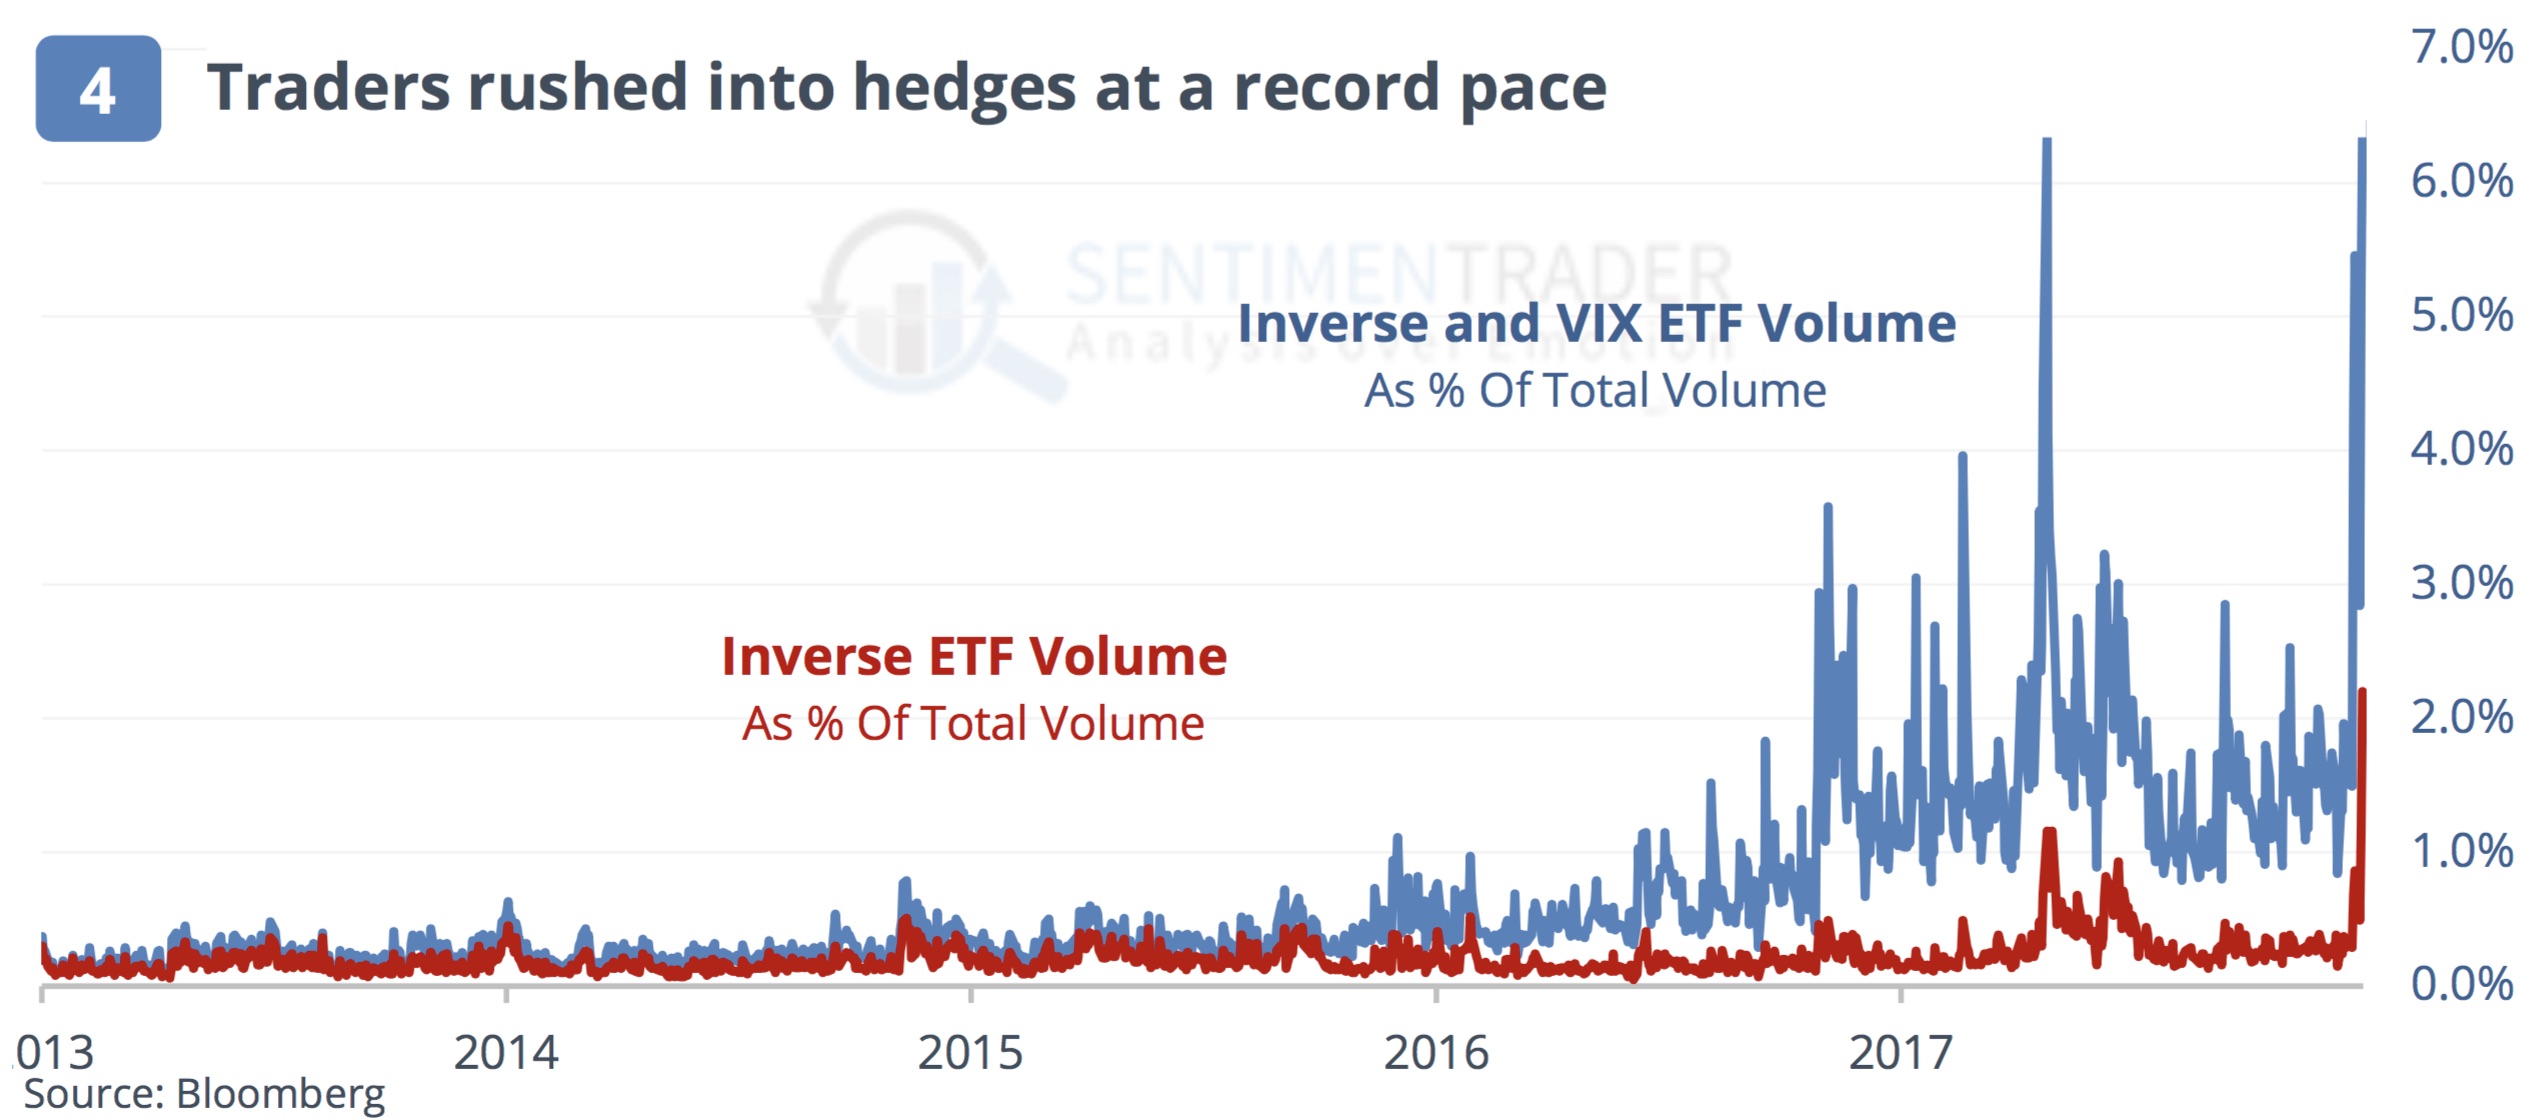
October 12 (King World News) – Here is a portion of today’s note from Jason Goepfert at SentimenTrader: Inverse ETF volume exploded, as program selling reached multi-year highs. When the indexes broke their early morning lows and selling pressure picked up, it reached a crescendo that hasn’t often been matched. Never, in some cases…
Jason Goepfert continues: For the first time in history, volume in inverse ETFs neared 2% of total NYSE volume, almost double the prior record from February. That’s remarkable.If we include volatility ETFs in the equation, then it exceeded 6% of NYSE volume, also a record, but just barely eclipsing February when the volatility products were a much bigger deal. (see chart below).
First Panic Reading…
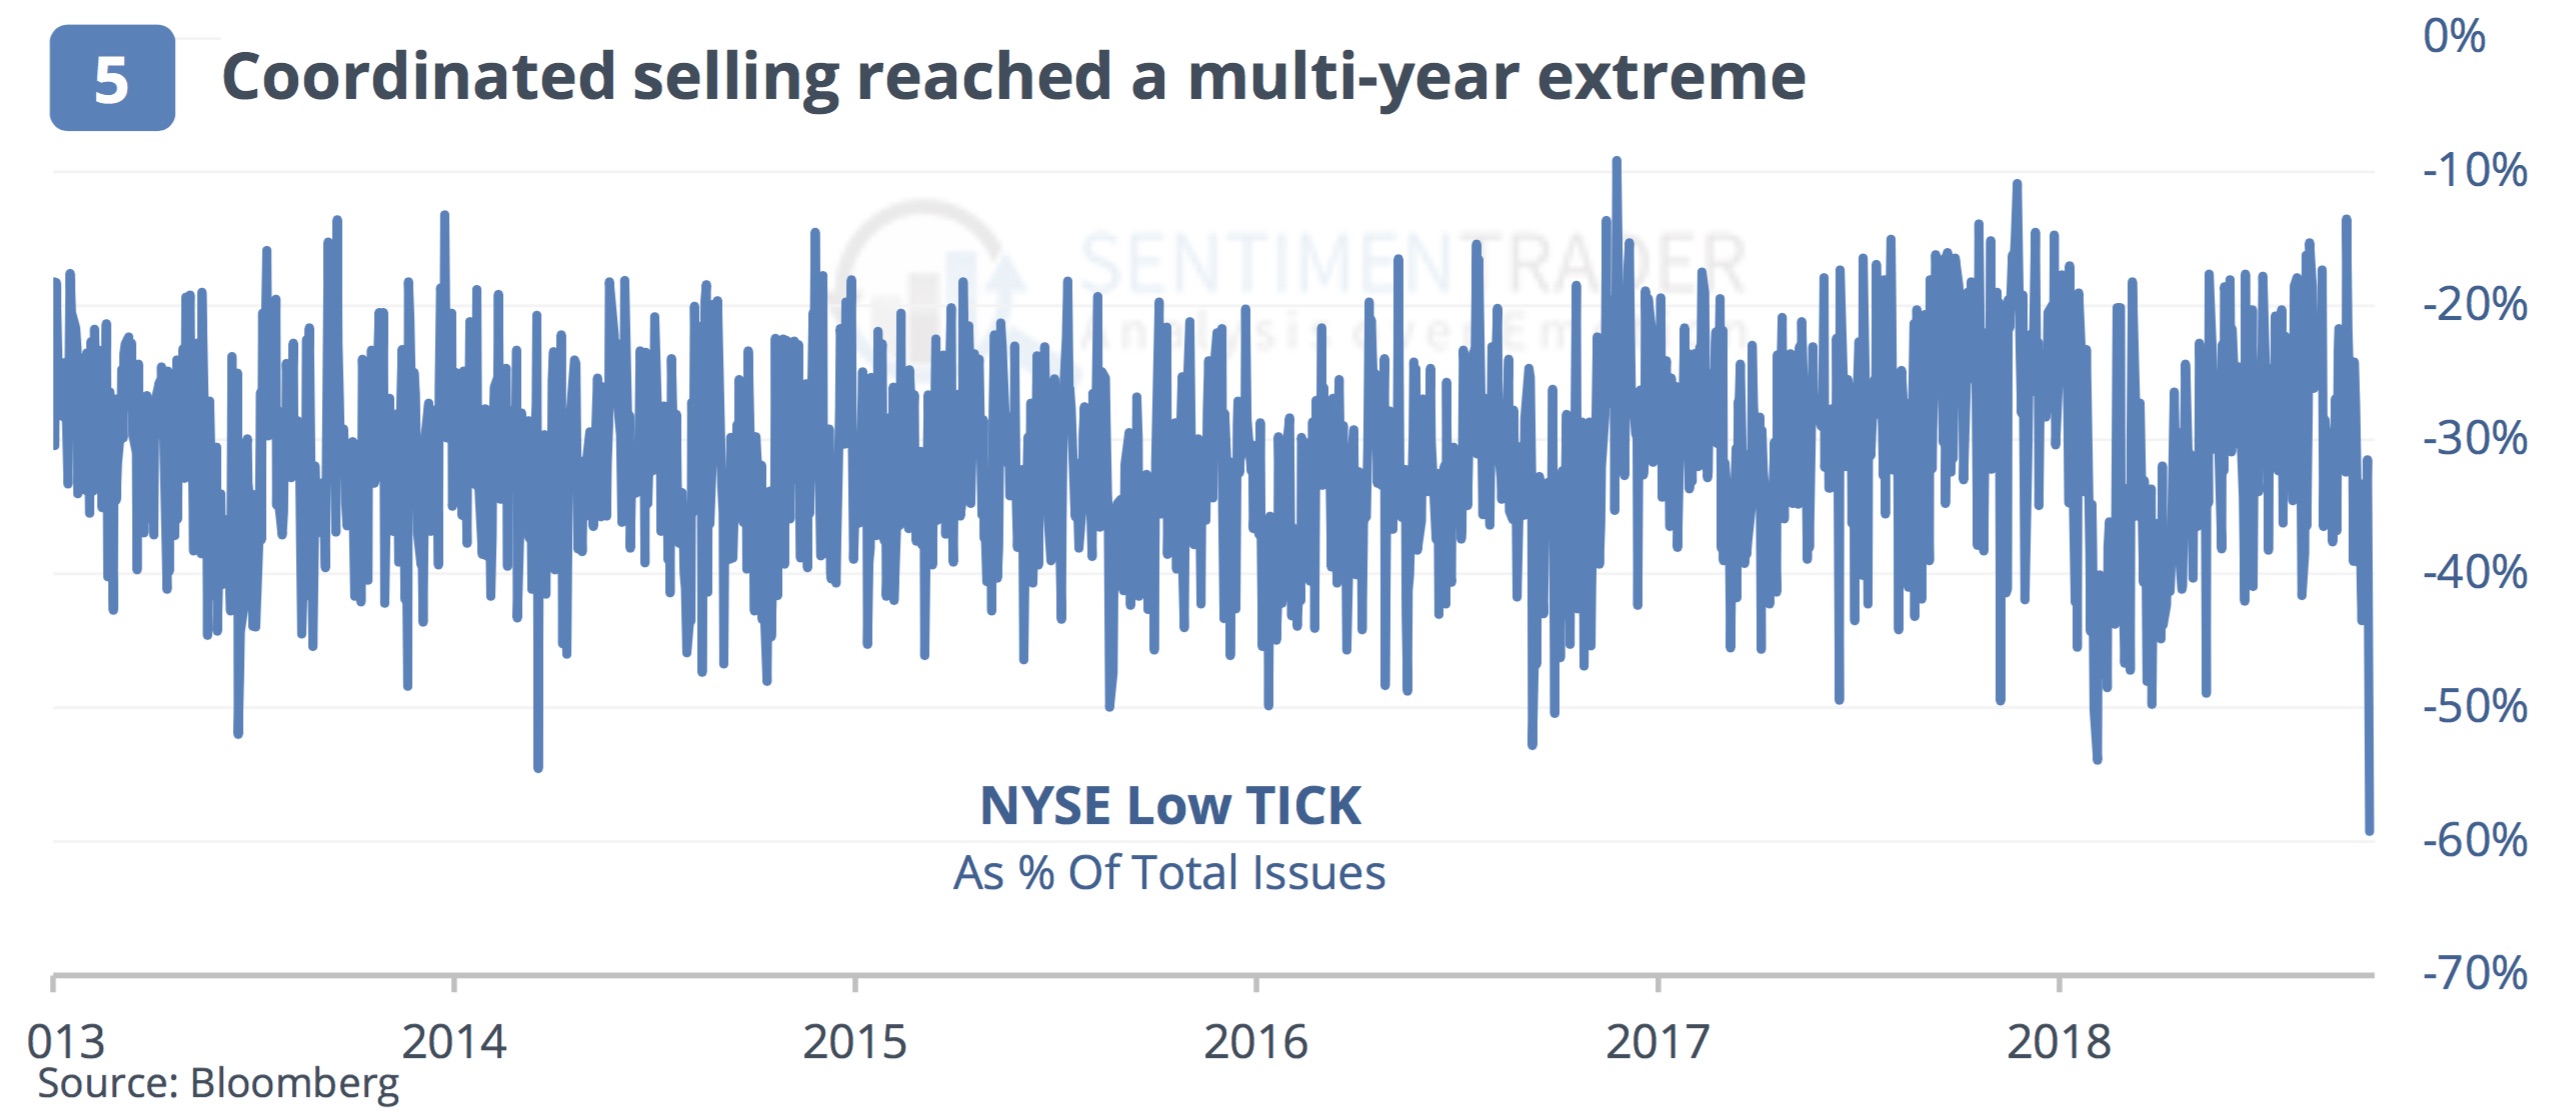
At the worst point on Thursday, nearly 60% of the NYSE was ticking lower, the worst since 2011(see chart below).
Second Panic Reading…
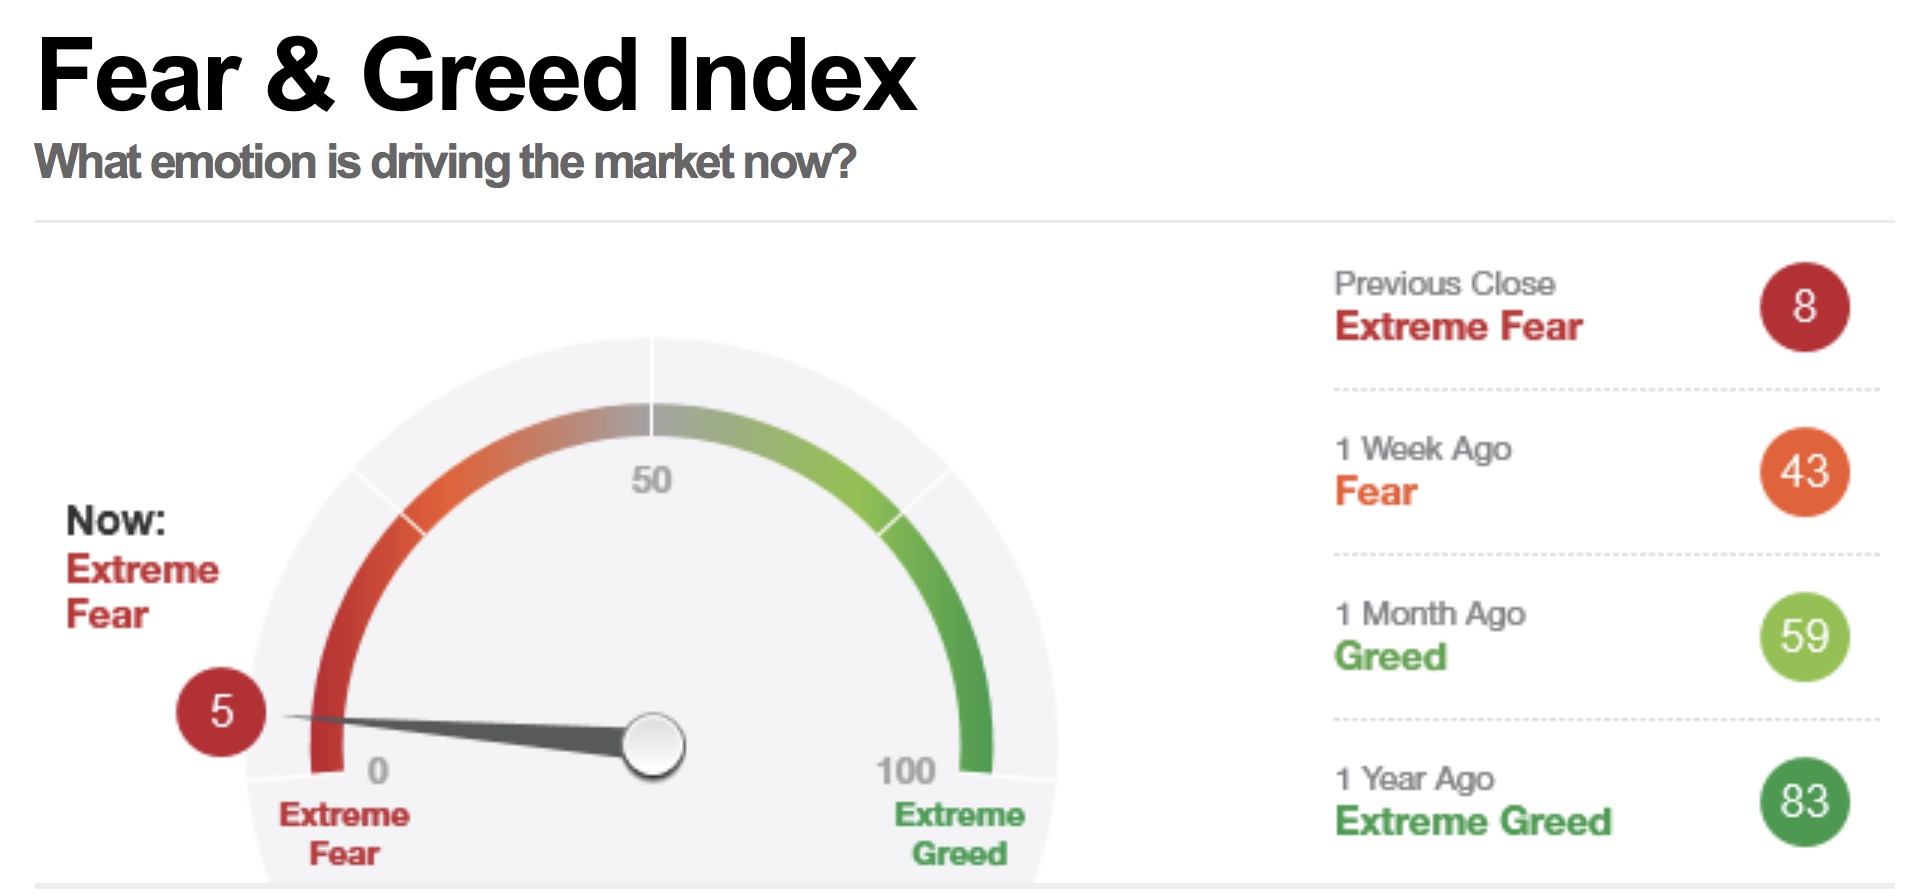
The CNN Fear & Greed proxy model fell even further, now below 8. We don’t see that very often, even during bear markets (see below).
EXTREME FEAR: Fear & Greed Index Hit 5 Yesterday!
There is much more to this special report from SentimenTrader but it is only available to subscribers. To subscribe or try a free two week trial to the internationally acclaimed work that Jason Goepfert produces at SentimenTrader CLICK HERE.
What could go wrong???
Look at these stunning images of panic from this week’s brutal...


Add to My Watchlist
What is My Watchlist?
 (20min delay) (20min delay)
|
|||||
|
Last
2.3¢ |
Change
0.000(0.00%) |
Mkt cap ! $33.26M | |||
| Open | High | Low | Value | Volume |
| 2.4¢ | 2.4¢ | 2.3¢ | $53.77K | 2.257M |
Buyers (Bids)
| No. | Vol. | Price($) |
|---|---|---|
| 14 | 2535204 | 2.3¢ |
Sellers (Offers)
| Price($) | Vol. | No. |
|---|---|---|
| 2.4¢ | 679965 | 2 |
View Market Depth
| Last trade - 16.10pm 25/07/2025 (20 minute delay) ? |
| ARD (ASX) Chart |