Share
What is a 'Morning Star'
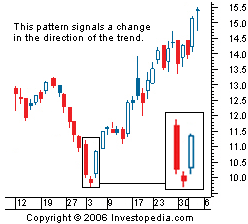
A morning star is a bullish candlestick pattern that consists of three candles. The first bar is a large red candlestick located within a defined downtrend, the second bar is a small-bodied candle (either red or white) that closes below the first red bar, and the last bar is a large white candle that opens above the middle candle and closes near the center of the first bar's body.
BREAKING DOWN 'Morning Star'
There are two forms of analysis: technical and fundamental. Fundamental analysis relies on business performance to provide clues about future stock performance, whereas technical analysis relies on price patterns. These price patterns are either bearish or bullish, meaning that they provide a signal to the trader to sell or buy. Technical analysts use candlestick charts to find price patterns because they help traders spot pricing trends and patterns like the morning star.
Morning Star Formation
Candlestick boxes can take on many shapes. Some candlestick patterns are based on one candlestick, like the doji. Other candlestick patterns, such as the morning star, are based on multiple candlesticks. The morning star is based on three candlesticks.
The first candlestick in a morning star pattern is a long, bearish candle indicating a large drop in price. The second candle is a small bullish or bearish candle indicating indecision. The third candlestick is a large bullish candle indicating a large increase in price. The candlestick may look like nothing more than a box with two lines coming out of either end, but each candlestick contains information about the open, high, low and close price for the stock given the time period.
On June 16, 2016, Coromandel International's stock price closed down, forming a long bearish candle. The next day, following a sharp downtrend, the stock created a doji candlestick signaling indecision and a possible reversal. On the third day, June 20, 2016, the company's stock price surged, creating a long bullish bar and confirming the reversal. This is an example of a morning star formation, and it suggests the price is headed higher, at least in the short term.
Morning Star Interpretation
The morning star is signaling a change in trend from bearish to bullish. Traders use it as an early indication that the downtrend is about to reverse. A morning star pattern can be useful in determining trend changes, particularly when used in conjunction with other technical indicators. Many traders also use price oscillators such as the moving average convergence divergence (MACD) and relative strength index (RSI) to confirm the reversal.
Read more: Morning Star https://www.investopedia.com/terms/m/morningstar.asp#ixzz55X7IgsdU
Follow us: Investopedia on Facebook
- Forums
- ASX - By Stock
- Ann: Preliminary Environmental Approval
[IMG]Share [IMG] [IMG] What is a 'Morning Star' A morning star...
-
- There are more pages in this discussion • 1 more message in this thread...
You’re viewing a single post only. To view the entire thread just sign in or Join Now (FREE)
Featured News
Add TON (ASX) to my watchlist
 (20min delay) (20min delay)
|
|||||
|
Last
0.9¢ |
Change
0.000(0.00%) |
Mkt cap ! $14.11M | |||
| Open | High | Low | Value | Volume |
| 1.0¢ | 1.0¢ | 0.9¢ | $7.465K | 801.6K |
Buyers (Bids)
| No. | Vol. | Price($) |
|---|---|---|
| 13 | 2766975 | 0.9¢ |
Sellers (Offers)
| Price($) | Vol. | No. |
|---|---|---|
| 1.0¢ | 235854 | 3 |
View Market Depth
| No. | Vol. | Price($) |
|---|---|---|
| 13 | 2766975 | 0.009 |
| 12 | 2475672 | 0.008 |
| 3 | 477619 | 0.007 |
| 5 | 931975 | 0.006 |
| 2 | 899995 | 0.005 |
| Price($) | Vol. | No. |
|---|---|---|
| 0.010 | 235854 | 3 |
| 0.011 | 1831178 | 5 |
| 0.012 | 1812797 | 7 |
| 0.013 | 700000 | 2 |
| 0.014 | 299399 | 1 |
| Last trade - 16.10pm 06/11/2024 (20 minute delay) ? |
Featured News
| TON (ASX) Chart |


