https://www.bhp.com/news/prospects/2017/11/ten-reasons-why-we-like-copper
This is an oldie, but it is coming right from the horse's mouth.Ten reasons why we like copper
Copper is an extremely attractive commodity.
A year ago, we outlined our Bullish Thesis for Copper. Here we build on that work by outlining why BHP remains committed to the pursuit of organic growth in the red metal.
The ten reasons put forward – five supply related, five demand related - range across all aspects of our proprietary framework for assessing the attractiveness of commodities.
The supply side
1. Systematic grade decline and resource depletion. Primary output from currently operating mines is reportedly likely to decline over the coming decade. This is due to the long-anticipated decline in grade that is endemic to the porphyry resource base that currently dominates global supply. That is a geological fact. The implication is that new mines will have to be developed to offset this decline and to meet rising demand.1 Our view is that this will be no easy or inexpensive matter.
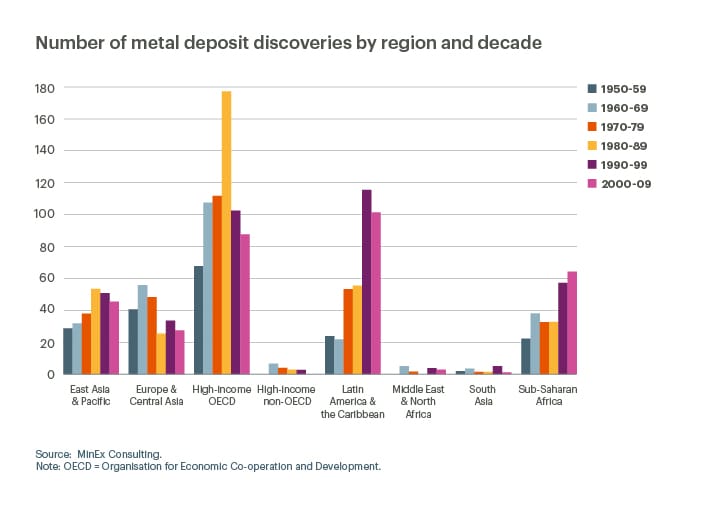
2. Lack of big bang exploration success. Global copper mine output is currently built on a foundation of giant deposits with low operating costs that were discovered and developed decades ago. By major region, the discovery of metals deposits peaked in the following decades:
Europe and central Asia 1960s
High income OECD 1980s
East Asia and Pacific 1980s
Latin America 1990s
Sub-Saharan Africa 2000s
Source: Minex Consulting & the International Monetary Fund.To confidently predict that the industry wide cost curve will not steepen as today’s giants age, one would need to have observed a portfolio of like-for-like deposits being discovered and developed on the required timeframe. The reality is that this has not been the case. Analysis2 shows that Tier-I discoveries across the minerals sphere have become scarce in the new millennium, with an additional slowdown post GFC. Copper is no exception. Our view is that it is extremely likely that the copper cost curve will steepen in the 2020s, as the absence of a significant new generation of Tier-I assets will leave lower quality and/or higher cost deposits to fill the looming gap. The expansion of Olympic Dam is a likely exception to this rule.
3. Above ground risk. In our discussion of exploration success above (or more correctly, the lack of it), we noted the volume of metal discoveries in the OECD countries, where ‘above ground risk’- or challenges associated with bringing a product to market - is relatively low, peaked in the 1980s. The only region where the rate of metals discoveries increased in the 2000s over the preceding decade was Sub-Saharan Africa, where above ground risk is relatively high. All other things being equal, the higher the level of above ground risk, the lower the probability of a discovery proceeding to development and, ultimately, contributing to global production. Above ground risk has been shown to act as a curb on exploration success. A recent study by the International Monetary Fund3 concluded that improvements in political risk are a powerful driver of the rate of metal discoveries. In terms of today’s copper market and its expected development in the second half of the 2020s, and beyond, this has major implications. If the most prospective areas for copper exploration now are in regions where above ground risk is materially higher, on a weighted basis, than in the 1980s and 1990s, then it is likely the probability of discoveries is now much lower, and the probability of developing what is discovered has also fallen.4. Water constraints. According to the CSIRO, around 1600 litres of water is required to produce the copper used in a conventional internal combustion engine vehicle.4 Regions that are either arid or are projected to suffer high water stress5 and are also important copper producing regions, include the Atacama region of Latin America; the south west of the United States; Central Asia and southern Africa. Desalination plants can help provide water security for individual operations, but they require large capital outlay to install and considerable energy to run. Where desalination solutions are not pursued, competing with other commercial users and the broader community for resources in water scarce regions can be extremely challenging. In copper, as in mining more generally, effective, ethical water stewardship is expected increasingly to emerge as a competitive advantage for those operators that get it right. For those that do not, their ability to maintain their social license to operate may come into question.
5. Rational market dynamics. The copper mining industry has shown itself to be a relatively rational dynamic engine when under stress. The 90th percentile on the cash cost curve has served as an effective floor for copper prices during cyclical downturns. Not all commodities exhibit such dynamics, with sticky uneconomic supply in some markets allowing prices to fall below the 90th percentile, and sustain there, for years at a time. Copper prices bounced off the 90th percentile in the recent downturn, illustrating that even in a world of zero interest rates, with sticky supply evident in a number of other commodities, dynamic rationality was the order of the day in copper.
The demand side – traditional arguments
6. Chinese consumers. The increasing importance of household consumption in the Chinese economy should provide a boost to copper demand across a range of end-use sectors, including autos, technology products (e.g. smart devices), and household durable goods (e.g. air conditioners). While the residents of China’s Tier-I and Tier-II cities are already established in an urban consumer lifestyle, residents of lower tier cities (the vast majority of the ~53% of the population already living in urban areas) and the ~47% of the population still residing in the countryside, have a great deal further to go in this regard. Furthermore, the process of upgrading the quality of the urban dwelling stock is not just about raw living space - it is about wiring that space to best effect.
7. India rising. The development trajectory of India is expected to be a major boon for copper demand. India’s urban consumers are decades behind their Chinese counterparts in terms of all key end-use sectors important to copper (with the exception of televisions). The urban population share itself is also still low. Additionally, where India’s infrastructure endowment is concerned, both quantity and quality gaps abound. The long run demand opportunity presented by a successful development drive in India is huge in aggregate and broad based by sector.
The demand side – technological mega-trends
8. The electrification of energy demand. Our projections assume that the demand for electricity will outstrip the growth in total primary energy demand between now and mid-century. The production, distribution and transmission of all that power will require a great deal of copper.
9. The electrification of transport. The mega-trend within the mega-trend. As a battery powered electric vehicle (EV) contains four times as much copper as a conventional medium sized car (around 80kg versus around 20kg), the red metal is expected to be a big winner from the electrification of the light duty vehicle fleet. Among the range of possibilities that we consider, our mid case estimate is the EV fleet6 rises towards 230 million in 2035 and around three quarters of a billion in 2050 (i.e. roughly half of the fleet). Under a green scenario enabled by more rapid technological progress and an even more supportive policy environment, it is possible that we could hit half a billion EVs by 2035 and move well beyond the one billion mark by mid-century. And as EVs move into more and more segments of the light duty vehicle market, and those EVs carry more and more sophisticated onboard computer systems, it is unlikely that the current assumption of 80kg of copper per car will continue to hold, and the direction of change will be upwards. Indeed, researchers at UBS already put the figure at 90kg.7
10. Wind and solar. The growth of both wind and solar power generation capacity since the turn of the century has been nothing short of spectacular. So too have been the reductions in hardware cost associated with the rapid building up of new manufacturing capacity. Wind and solar are rapidly closing the unsubsidised cost competitiveness gap with traditional power generation across the world’s major markets. Attractive long run economics, plus the important role that renewables will need to play in the decarbonisation of the world economy, promise a sustained high growth path for wind and solar. From a copper point of view, the per megawatt hour demand coefficient associated with offshore wind generation is almost five times that associated with coal generation. For solar, the coefficient is around two and a half. Fast growing and copper hungry - that makes the wind and solar revolution a worthy conclusion to our catalogue of reasons to like copper.
1. In addition to new primary mine supply, we acknowledge that increased scrap supply is expected to play a role in meeting demand for copper semis and offsetting grade decline, with increased availability of secondary supply in China, the shadow of the copper intensive boom of the first decade of this century, the major force.
2. http://www.minexconsulting.com/publications/Exploration%20Trends%20and%20Outlook%20-%20PDAC%20Presentation.pdf
3. https://www.imf.org/external/np/res/commod/pdf/WEOSpecialOCT15.pdf
4. https://www.csiro.au/en/Research/MRF/Areas/Community-and-environment/Responsible-resource-development/Water-footprint
5. For more details, see The World Resources Institute’s Aqueduct database http://www.wri.org/applications/maps/aqueduct-country-river-basin-rankings/#x=0.00&y=0.00&l=2&v=home&d=bws&f=0
6. Here we use the EV definition as battery powered vehicles plus plug-in hybrids. The battery powered share of the 230 million is around 140 million, as indicated here.
7.UBS Global Research, 29 August 2017, “Copper: Electric Vehicles & Charging Infrastructure to Accelerate Demand”, p. 2.
Ann: Preliminary IPO Prospectus Lodged- TSXV Listing Application, page-233


Add HCH (ASX) to my watchlist
 (20min delay) (20min delay)
|
|||||
|
Last
94.5¢ |
Change
-0.015(1.56%) |
Mkt cap ! $143.0M | |||
| Open | High | Low | Value | Volume |
| 95.5¢ | 97.0¢ | 94.5¢ | $43.05K | 45.11K |
Buyers (Bids)
| No. | Vol. | Price($) |
|---|---|---|
| 1 | 166 | 94.5¢ |
Sellers (Offers)
| Price($) | Vol. | No. |
|---|---|---|
| 95.0¢ | 5953 | 1 |
View Market Depth
| Last trade - 16.10pm 17/07/2024 (20 minute delay) ? |
| HCH (ASX) Chart |