I had originally quite liked your attempt at analysis @GMT2, as it is what this forum needs, but you’ve gone way off the deep end and are misleading people.
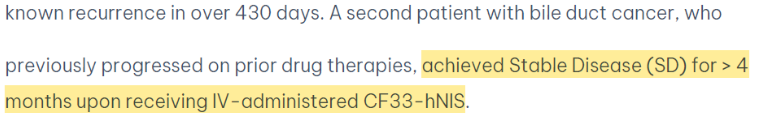
The use of the word “best” with regards to responses in the update announcements and throughout the poster reflects the most favorable outcome achieved during the study period. It is highly likely that patients who recorded a poor "best" response have begun to regress clinically. Such is the way with chemoresistance and cancer. For example, a patient receiving IV CF33 achieved a stable disease for >4 months. If they were still clinically SD, it would be stated like it was for the CR patient, therefore, this patient has progressed. Four months is roughly 120 days.
Typically, an effective cytotoxic agent will function very quickly, particularly when injected directly into a tumor. A change in tumor response similar to the cholangiocarcinoma patient would have been reported by IMU, so investors can only reasonably conclude that it has not happened. It is impossible for you to come to the conclusion that increased study duration improves response to treatment based on the information available at this time. Therefore, what is actually happening is the opposite of what you are saying.
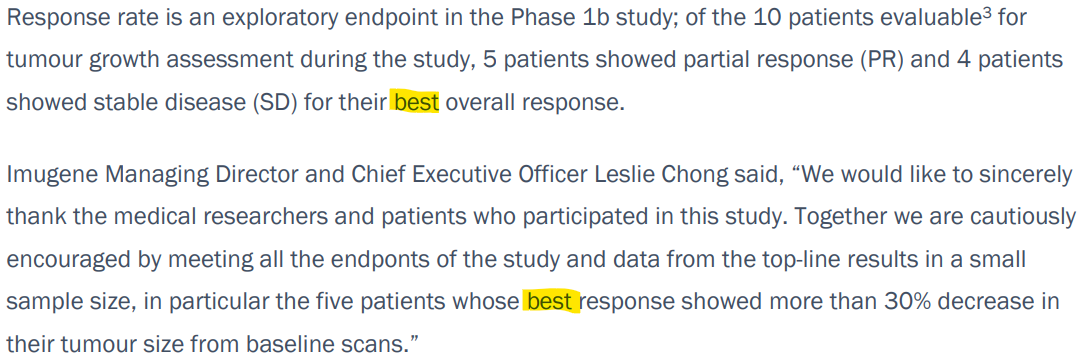
For an example of a clinical stage oncology company using “best” response, here is a clip from a summary announcement of P1 trial data of HER-Vaxx - we all know how that turned out:
Intra-Individual Variability in Cancer Response
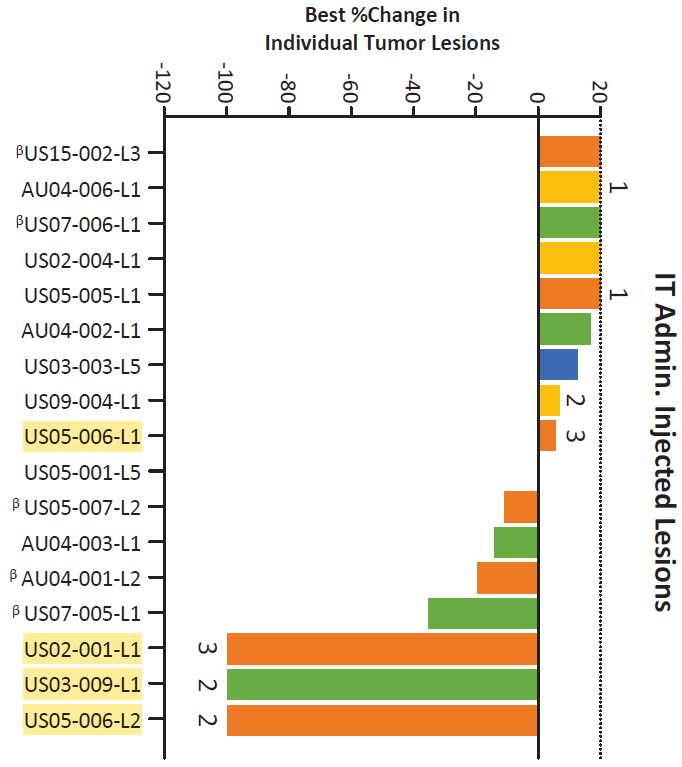
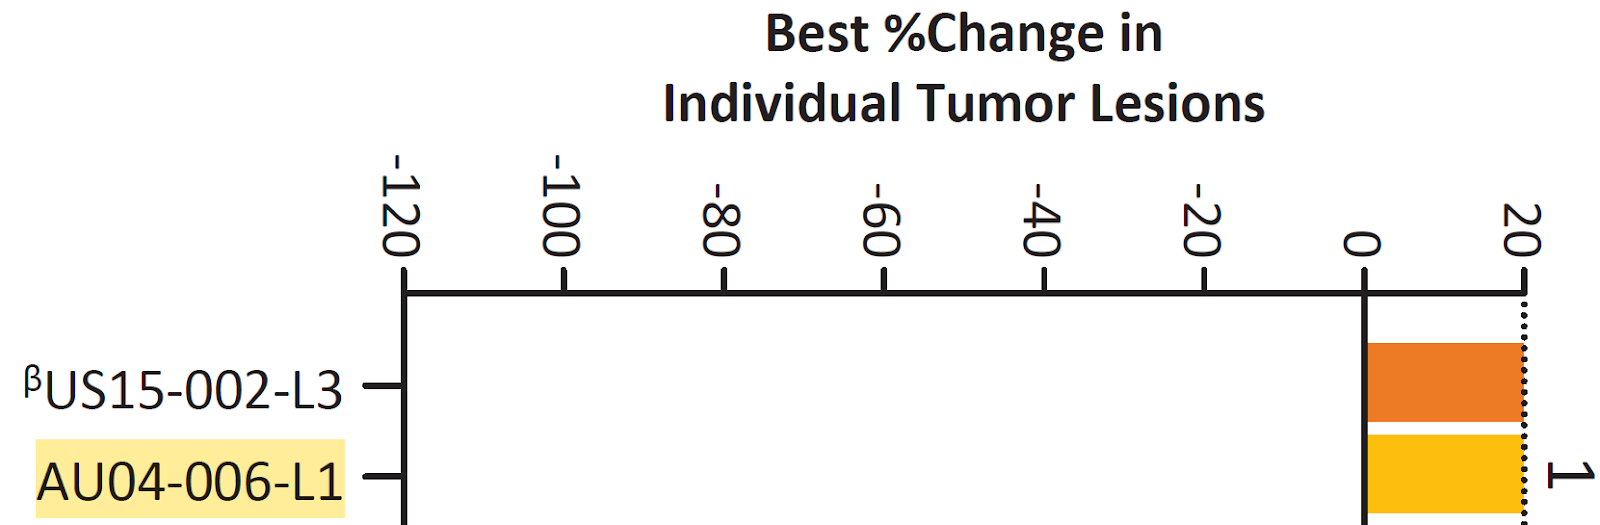
The chart that you have referred to is BEST %Change in INDIVIDUAL Tumor Lesions. There really isn’t much to be happy about here, as it showcases why CF33 is struggling clinically if you compare the two graphs together. The 3 100% reductions in lesion size is certainly what you want, however, the other lesions of the same cancer type in the same person have responded poorly or not at all (with US02-001 being the exception - well done that patient). While these are two great examples, there are numerous response inconsistencies throughout that will be discussed later. Let’s have a look:
US05-006 L2 (Lesion 2)
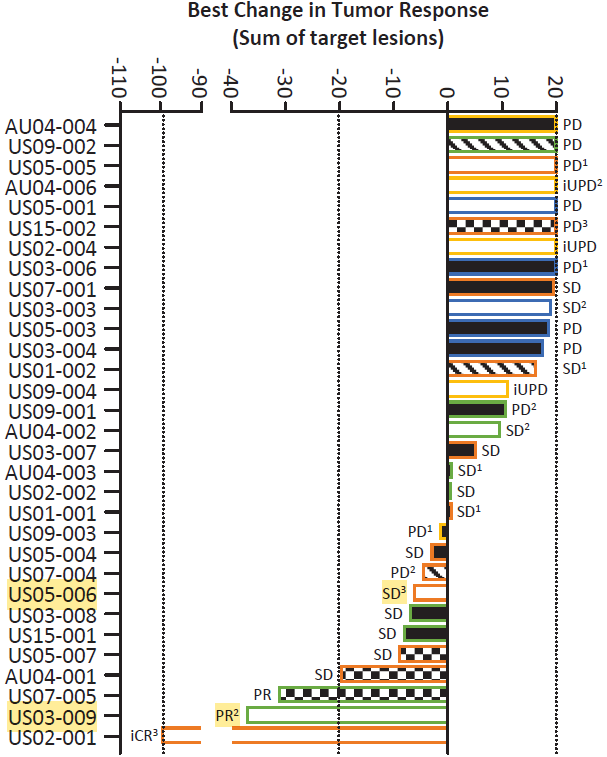
100% reduction in lesion 2, but achieved an overall stable disease with roughly -7.5% best tumor response (below). This means that the cancer had to have progressed or not responded in multiple other lesion sites. Simply look at the midline of the graph to find lesion 1 from patient US05-006 that had intense viral replication, but the tumor grew. No report if immune-related progression. Inconsistency in response within the same tumor type of the same patient indicates the treatment is not effective.
US03-009 L1 (Lesion 1)
Once again, a single lesion with 100% reduction in lesion size, but an overall best change in tumor size of -38% (below). Meaning the lesion response rate is inconsistent within the same patient. Inconsistency in response within the same tumor type of the same patient indicates the treatment is not effective.
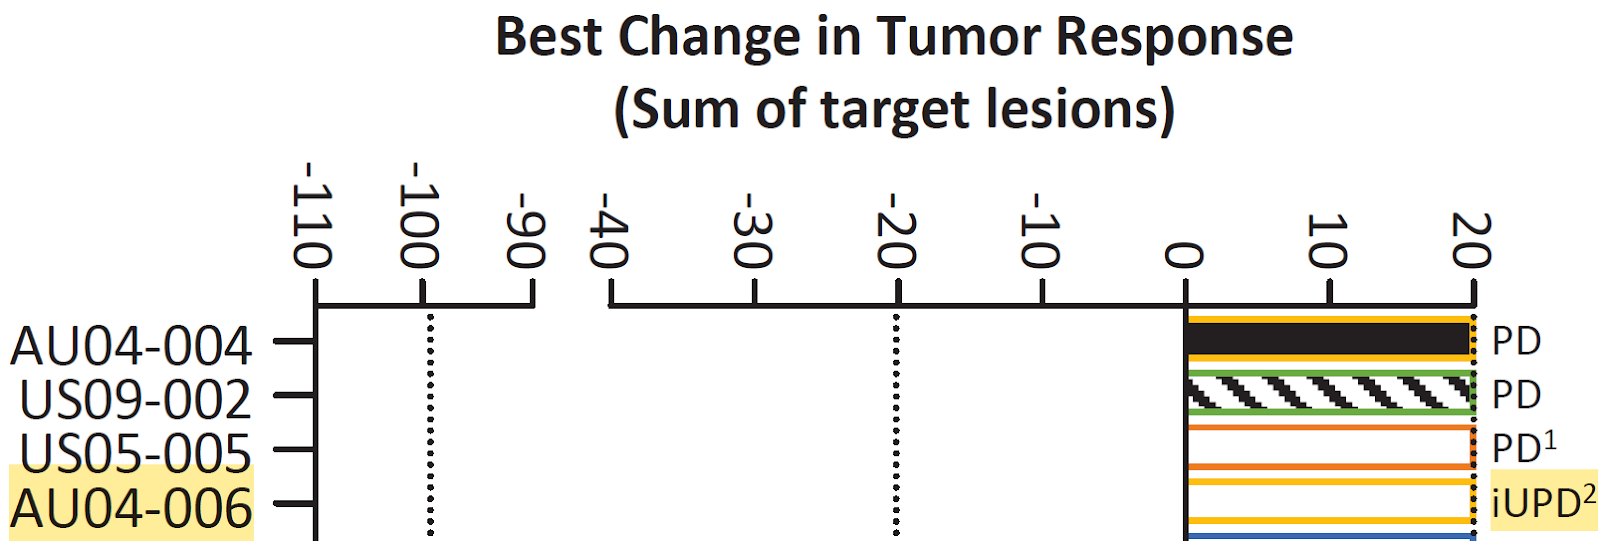
Lastly, is it a mild or moderate best viral replication score for patient AU04-006 in the 4th cohort?
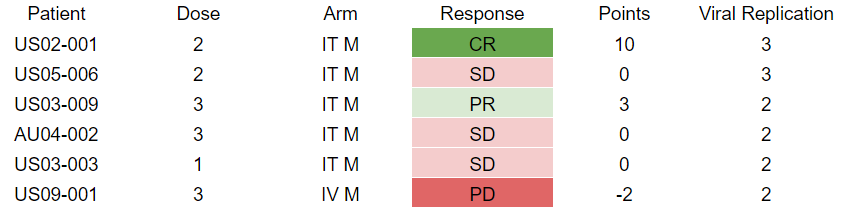
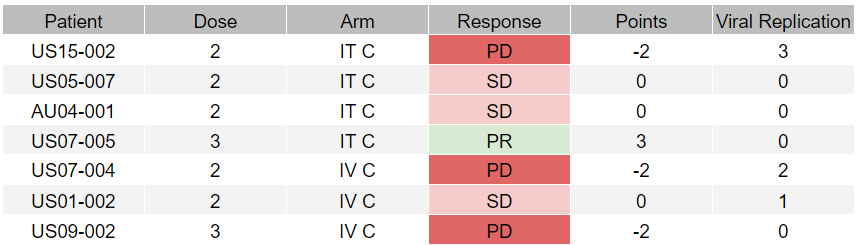
Efficacy Inconsistent with Increasing Dose
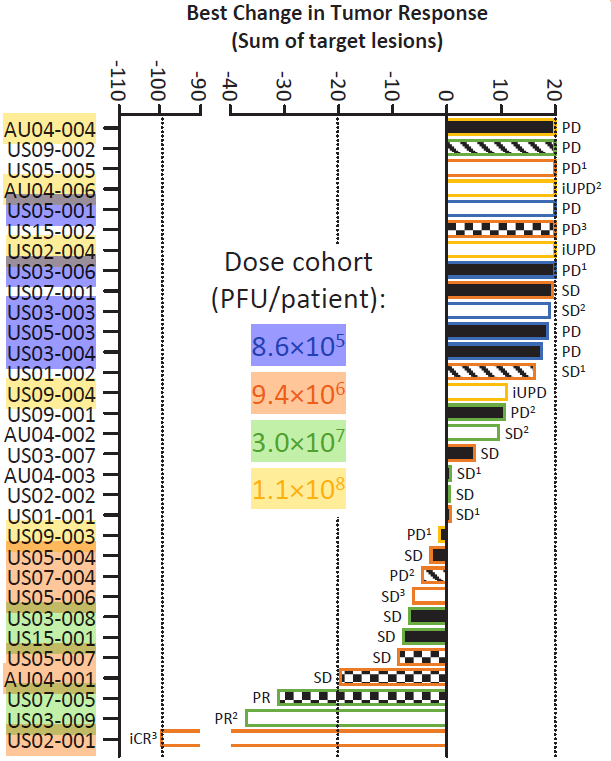
I have highlighted some of the best and worst responders for different dosing ranges that have been completed to date and shared the graph below. There is a clear separation of colors on the table, with 4th tier (yellow) and 1st tier (blue) (worst responders) at the top, while 2nd tier (orange) and 3rd tier (green) (best responders) at the bottom. The only dosing tiers to achieve a tumor regression response are the 2nd and 3rd tier, with the 2nd tier being the standout by far. The 1st tier and 4th tier have demonstrated no responses.The dosing and response data from this phase 1 trial so far suggests that the optimum dosing regimen has been met, since increasing the dose from 10^7 to 10^8 had a significant negative impact on tumor response - quite literally all patients dosed with the greatest concentration of CF33 had progressive disease (view below). This is reinforced by the notion that the 2nd dosing tier is the only regimen that achieved intense viral replication. The greatest dose of CF33 has so far produced the worst results of the study.
I’ve taken all of the monotherapy CF33 data from this paper and created a spreadsheet to run analysis on it. Of the 24 patients evaluable for a response to single agent CF33, 8.3% (2/24) of patients achieve greater than a 10% reduction in tumor size. Meaning 91.7% of patients had less than 10% reduction and 77% (17/22) of poor responders demonstrated increases in tumor size as their best response. Applying a point ranking system based on the specifics of the graphs: PD = -2, SD = 0, PR = 3, and CR = 10. By simply adding the data together into each dosing tier, we can see a visual representation of the efficacy per dosing tier.
Moreover, there is no correlation between dose and best viral replication. As you can see from the graph below, the trendline is flat. This indicates that viral replication is dependent on the specific cancer type, which, as discussed, is inconsistent within the same patient. Such is the heterogenous nature of cancer and the established difficulty with theraputic oncology agents. CF33 achieved a 0 viral replication score in 50% of the patients treated, and 92.3% of patients treated with IV therapy achieved a best viral replication score of 1 or less.This has deep implications in the clinical application of CF33 in metastatic, aggressive cancer types, as CF33 is unable to travel to other cancerous tissues in the body, infect the cell, and initiate cell death. When CF33 is injected directly into a tumor (n = 11), the patient is almost as likely to achieve a 0-1 best viral replication score (5 = 45%) as they are a score of 2-3 (6 = 55%). Patients dosed with the 4th tier achieved a 0-1 best viral replication score in 80% of cases. This has to be understood from the perspective that only a single lesion had to demonstrate replication to be listed as a best viral replication, while complete clinical responses are what drive commercial opportunities. Patient US05-006 is the perfect example where they achieve a strong response in lesion 2, but lesion 1 achieves non-immune related growth and their overall response is a sub 10% tumor response.
Pseudoprogression Is Not Common In Approved ICIs
There are currently 3 patients in cohort 4 with suspected immune-related unconfirmed progressive disease (iUPD). Reported best viral replication rates for these patients are none, mild, and either moderate or mild. It is unknown how many lesions per patient are demonstrating early signs of viral replication. It is impossible to say whether pseudoprogression is driving the increase in lesion size for cohort 4 without more data, but I believe the likelihood of pseudoprogression driving clinical responses in these patients to be extremely low. The following lines of evidence support this contention.
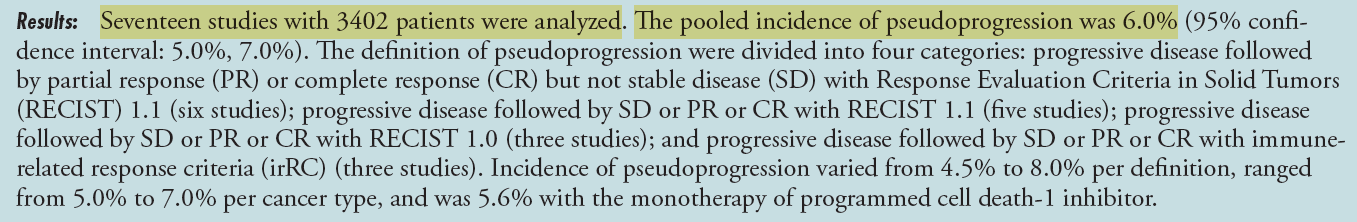
Average pseudoprogression rates are approximately 6% across 17 studies of approved immune checkpoint inhibitor drugs (below). These are approved compounds with proven clinical efficacy in a range of cancer types that far exceeds what CF33 has achieved thus far. Based on the information available, CF33 has achieved pseudoprogression in 4.2% of the 24 monotherapy patients. It is up to you whether you decide to include the IV monotherapy patients, as they responded so poorly to treatment and may skew the value. Of IT patients (n = 11), the pseudoprogression rate is 9%, which is above the average for approved ICIs. CF33 is demonstrating inconsistent inter-lesional efficacy within patients. Meaning, a single lesion that responds to treatment will not be enough to generate a clinically relevant response. The data available thus far suggests that viral replication does not increase with dosing. Moderate and intense are the only best viral replication rates that have achieved clinical responses (2/24; 8.3%) in patients, while 100% of mild to none best viral replication rates achieve a best response of SD or PD. Patients who achieve moderate best viral replication are 75% more likely to have SD or PD than PR. It is currently impossible to say whether patient AU04-006 has a best viral replication score of mild or moderate, therefore it is impossible to predict the chance of success.
https://www.ncbi.nlm.nih.gov/pmc/articles/PMC7526949/pdf/radiol.2020200443.pdf
CF33 With Pembrolizumab
With only 7 patients to draw information from, it is difficult to come to any solid conclusions about combination efficacy. With a clinically and commercially proven therapy in Keytruda, I would have expected better results than what has been demonstrated. I see no evidence of synergy between the two compounds.
Limitations
There is limited clinical data evaluating the efficacy of CF33 in patients, so it is difficult to generate strong trends from the dataset - particularly for combination data. Evaluating data based on “best response” is challenging, as the "best response" metric reports the most favorable outcome achieved by each patient during the study period, even if their condition later worsens. This could mean that the actual analysis of this interim data is worse than reported. Also, the nature of research is exploratory and ongoing, so the addition of cohorts and more patient data may prove to be in favor of or work against the clinical efficacy of CF33 in patients.
Summary
In summary, the phase 1 trial data critically demonstrates that increased dosing of CF33 does not correlate with improved clinical outcomes in treating advanced solid cancers. Despite some individual lesions showing complete reductions, the overall ineffectiveness across multiple lesions within the same patient underscores a significant challenge with intra-individual variability in cancer response. This variability, coupled with the lack of correlation between higher doses and enhanced viral replication, indicates that the optimal dosing regimen may not benefit from increased quantities of CF33. Such findings highlight the complexity of oncolytic viral therapy and the necessity for a nuanced understanding of dose-response relationships in the context of cancer heterogeneity and treatment efficacy.
Based on the analysis above, I believe the likelihood of success from here is significantly low. If IMU are unable to generate meaningful CR’s in the trial expansion, I honestly do not see a floor for the MC until it reaches cash. This is evidenced by CF33 forming the backbone of 2 clinical programs and 3 separate arms within. I’ll be awaiting further clinical evidence for the efficacy for CF33 in advanced cancer patients.
I had originally quite liked your attempt at analysis @GMT2, as...


Add IMU (ASX) to my watchlist
 (20min delay) (20min delay)
|
|||||
|
Last
7.5¢ |
Change
0.005(7.14%) |
Mkt cap ! $548.9M | |||
| Open | High | Low | Value | Volume |
| 7.1¢ | 7.6¢ | 7.1¢ | $1.896M | 25.79M |
Buyers (Bids)
| No. | Vol. | Price($) |
|---|---|---|
| 9 | 3194318 | 7.4¢ |
Sellers (Offers)
| Price($) | Vol. | No. |
|---|---|---|
| 7.6¢ | 331280 | 7 |
View Market Depth
| Last trade - 16.10pm 10/05/2024 (20 minute delay) ? |

|
|||||
|
Last
7.6¢ |
Change
0.005 ( 6.34 %) |
||||
| Open | High | Low | Volume | ||
| 7.1¢ | 7.6¢ | 7.1¢ | 15199158 | ||
| Last updated 15.59pm 10/05/2024 ? | |||||
| IMU (ASX) Chart |