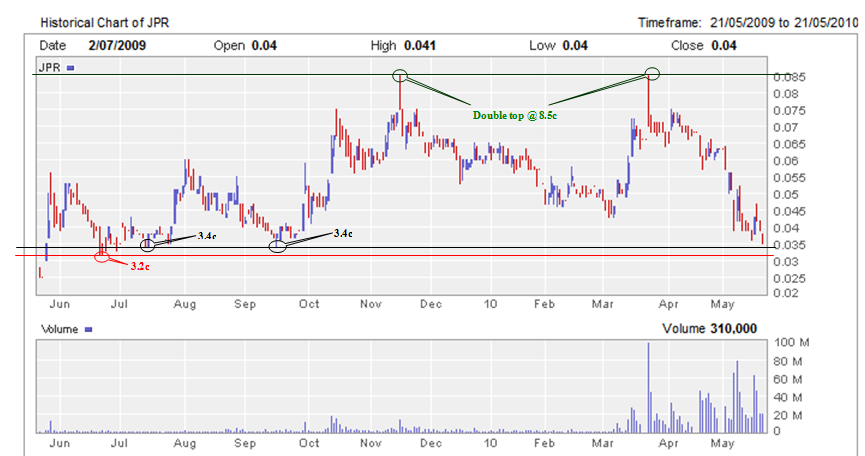
This chart shows the next levels of support at 3.4c and 3.2c i.e. points of prior bounces and the double top.
Why do I say it is pointless? Because the chart is at the mercy of one or two major shareholders who are playing it like a violin. We have not had two consecutive green candles since 4/5/2010, the first day of trading after the last trading halt. 450 million shares have been traded since 4/5/2010, which is half the issued share capital and we have not had a single form 404. I suspect we should have had at least one 404 since this date unless the major shareholders are hiding behind multiple anonymous nominee accounts.
I am running at a loss in this stock and could have averaged down today but will not do it until the volume slackens out and the shaking out stops.
This chart shows the next levels of support at 3.4c and 3.2c...


Add to My Watchlist
What is My Watchlist?
