Hello Coalboy
I have looked back over the last 15 years to obtain the lengths and price on movements typical for the cat.
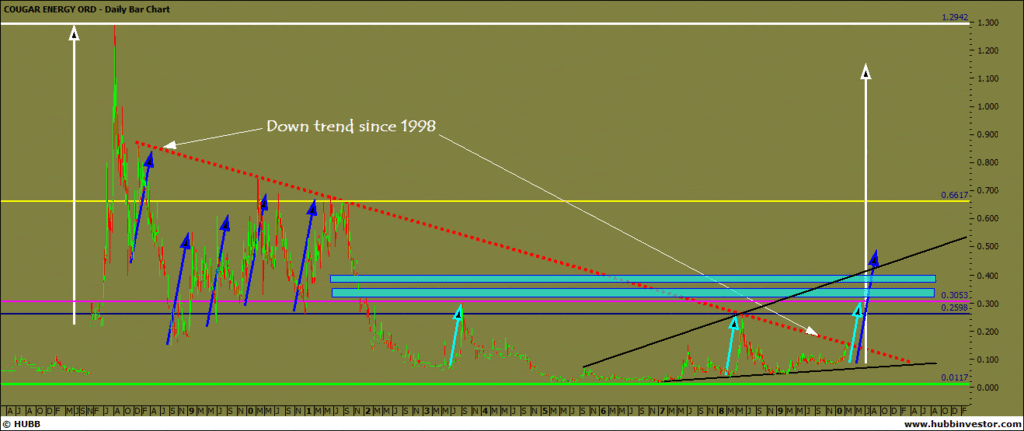
Looking at the dark blue and aqua speed angles will give you idea of the potential small and large leg ups that have happened over the last decade or so.
The two horizontal aqua boxes are gap that will eventually need filling.
Red dotted down trend line is being touched by a bullish candle for 7th time in 14years. Will this be the time we break the downtrend and look for the future uptrend....black ascending wedge is a short time uptrending line. Over the medium term I see both gaps closing and the price to find support on the pink horizontal line.....so thats the conservative outlook.
Now a very bullish look... Check out the white speed angles and the yellow horizontal line. Half the price of the all time high is 65cents ($1.30 being the high on this chart).
A decade ago 65cents was a common resistance area and also the 50% Fib retracement area.
After doing that chart, I think I may just have to buy some more.
Look forward to our spy Bunya's update soon. Anyone fly choppers for a living that could take a fly and check out whats happening next week at Kingaroy?
Hello CoalboyI have looked back over the last 15 years to obtain...
Add to My Watchlist
What is My Watchlist?


