There is a very interesting set of fibonacci relationships between the march low, the may and june highs, last nights SPX level and the 7th august. I wonder if this suggests a short term high last night. once again I had to print out the chart and carefully measure by hand. Consider the following :
D = 1.236 X A
B = .618 X A
D = 2 X B
C = 2.36 X B
I then used a fib arc again but this time referenced between the march low and the June top. I swung the 50% radius around to see where it would be on the 7th August as this is Voltaire's 155 days from the march low and is a Robbbb favourite. Surprise surprise, it lands right on the 38.2% retracement line of the march - june rally.
So as we have now passed through the outer arc of the march - may set of arcs support disappears for now. Between here and the 7th August there is the 38.2% arc of the march June arc set but it just all seems too convenient that 155 days from the low, 38.2% retracement of the rally and the 50% arc all coincide.....seems to me August 7th could be a low as the index finds support on the 50% arc. Also don't forget tomorrow we have an astro double whammy with a new moon AND a total eclipse...both these events often occur along with a turn in markets.
This IMO is still a very bullish scenario....the march June rally was the best since 1933 so a mere 38.2% retrace before the next leg up is not unhealthy.
....and one more thing. I stuck the pink lines on for a bit of good ol' fashion pattern analysis. One could argue that we have a broadening formation on the charts. According to that theory a swift and brutal retrace is also not out of the question between now and August 7th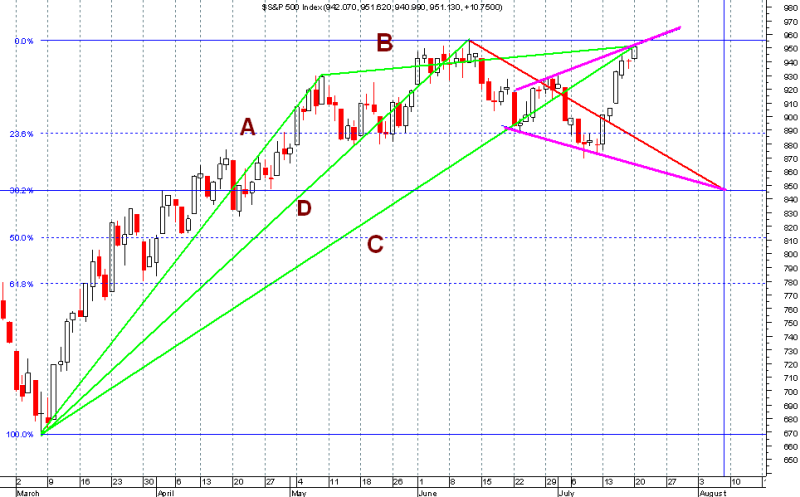


Add to My Watchlist
What is My Watchlist?
 (20min delay) (20min delay)
|
|||||
|
Last
8,603.0 |
Change
7.200(0.08%) |
Mkt cap ! n/a | |||
| Open | High | Low |
| 8,595.8 | 8,616.8 | 8,589.5 |
| XJO (ASX) Chart |