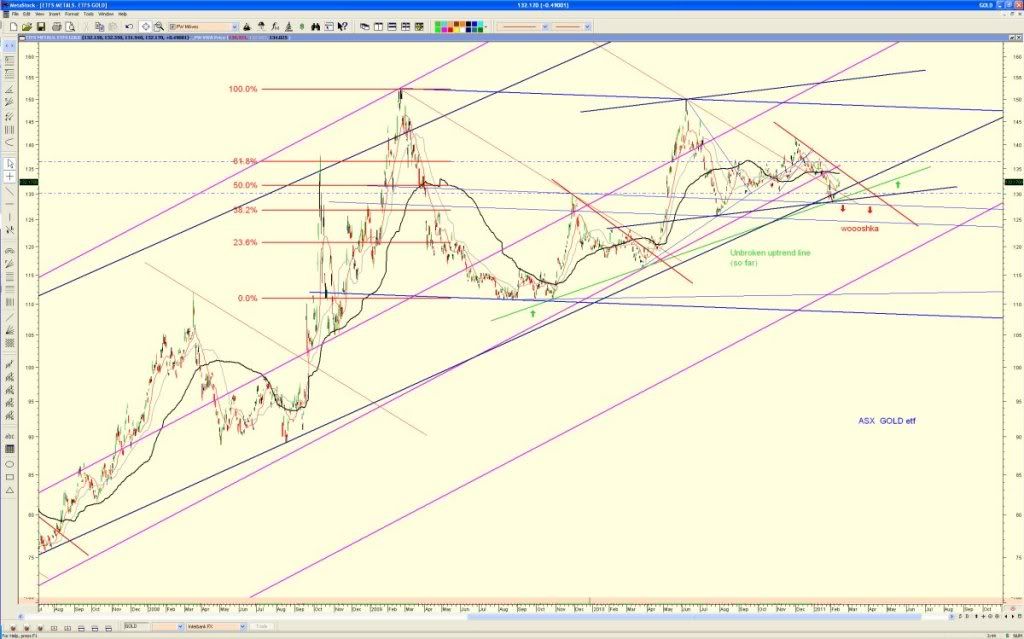
chart on the asx gold etf
i recently opened long gold at USD $1310 and closed them at $1362, all day yesterday and today I was thinking long?, short?, long?, short?.
b.gger, so I went long again today off the 1hour at $1362 thinking we might see the $1385 61.8fib retrace before any turn.
here's the gold etf chart looking bullish with the support channels turning over marginally. if it is going to collapse, then the next 1 month will see it. certainly before may2011 if it is to happen.
this chart accounts for both AUD and POG predictions, which is probably more linked than people are willing to admit.
all i can see are higher swing bottoms and tops ... yes, it may change, but it hasn't yet. it's currnetly sitting above the 50fib of the GFC exercise.
$1300 is a key level for the AUD POG. look for the green channel support to break down to the black channel support. Below $1280 will accelerate.
2011 might end with a POG around $1400 otherwise worse case.
So hold steady until it does, if it does.
Sinclair spoke of a swiss staircase, I can see it clearly in the gold and silver charts. it will keep working until it doesn;t.
aud gold etf chart
-
-
- There are more pages in this discussion • 13 more messages in this thread...


You’re viewing a single post only. To view the entire thread just sign in or Join Now (FREE)
Featured News
Add GOLD (COMEX) to my watchlist
The Watchlist
LU7
LITHIUM UNIVERSE LIMITED
Alex Hanly, CEO
Alex Hanly
CEO
SPONSORED BY The Market Online