Thursday gave us a bullish crossover for the SPX on the 18 and 45 day MAs. My Adapt.MA indicator is positive as is TRIX and MACD. So I believe the short term trend is up (SPX) for now.
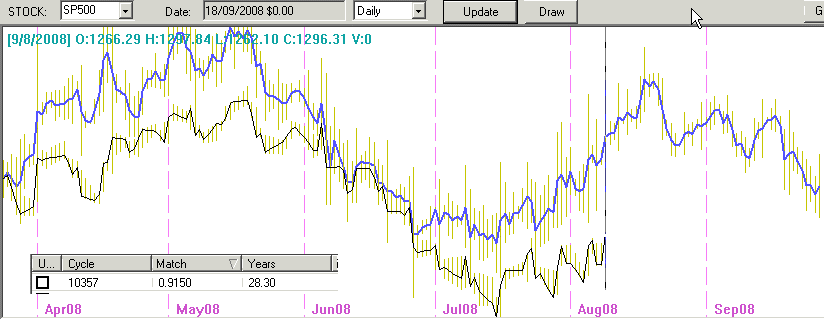
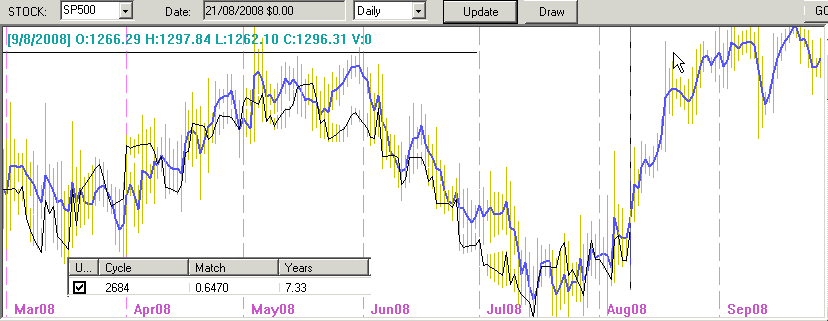
I can't say that is true for commodities since all of my indicators are bearish in that area. What shape the SPX uptrend will take I have no idea - it could be one of the following cycles which are the closest matching to current prices.
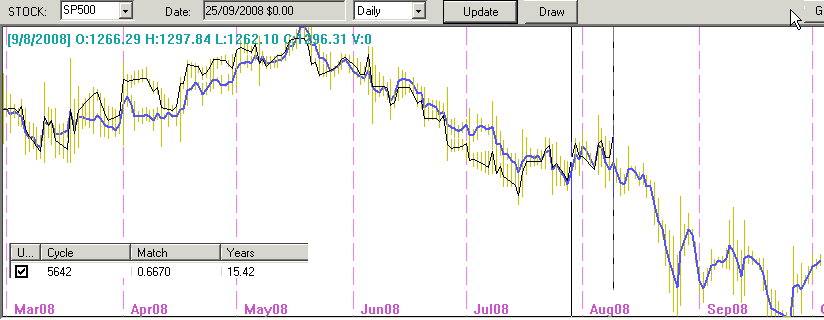
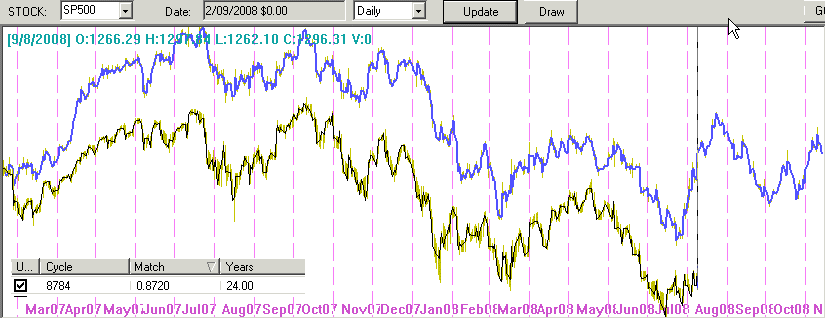
It appears that we are diverging somewhat from the scary and dominant 15.42 cycle but we are not out of the woods yet. (You will note that the 15.42 chart is a little different from last time I posted it since the cumulative data since then has modified to the cycle's shape a little). Any way enough chatter - here are the charts - and remember I have no idea what I'm doing (and I'm not being modest, I really don't) I guess Volt and others (from what I've read) would gravitate towards the patterns of the 24 and 28 year cycles.
15.42 year cycle
7.33 year cycle
24 year cycle
28.3 year cycle
- Forums
- ASX - By Stock
- XJO
- aug 8 tea leaves
aug 8 tea leaves
-
- There are more pages in this discussion • 102 more messages in this thread...
You’re viewing a single post only. To view the entire thread just sign in or Join Now (FREE)
Featured News
Add XJO (ASX) to my watchlist
 (20min delay) (20min delay)
|
|||||
|
Last
7,861.2 |
Change
-102.500(1.29%) |
Mkt cap ! n/a | |||
| Open | High | Low |
| 7,963.7 | 7,963.7 | 7,861.2 |
Featured News
| XJO (ASX) Chart |


