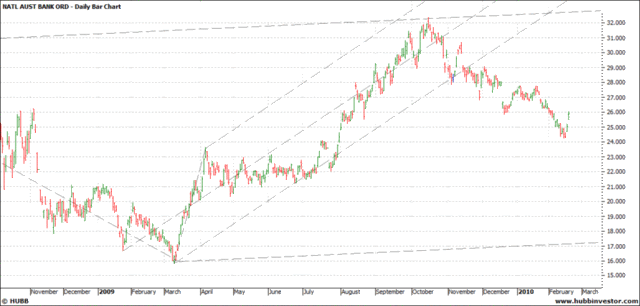
Hi Robbbb, I am not TD and probs poor substitute but love the pichfork (p/f) and I am attempting to go up the learning curve on these things ... had a play with NAB
Long term (see below); my thoughts, Like a median line that anchors way back in 2000, gets a near touch in 2004 and then the turn point in October 09 is right on the money.
[/IMG]
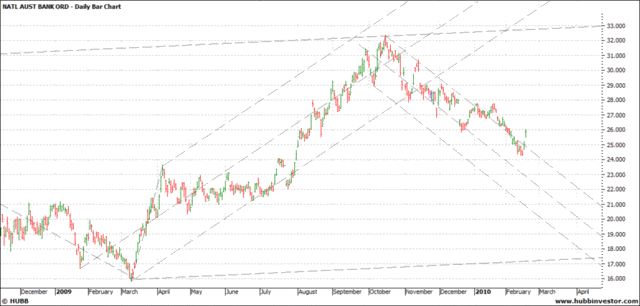
Lets add the more recent p/f's.
first the 09 rally: p/f does a reasonable job of defining the trend ....

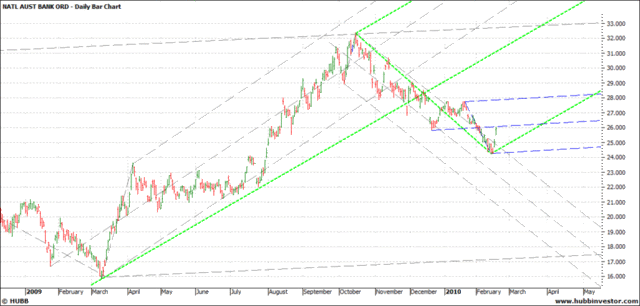
next add the 5 month 09 d/t: tried a break out in Jan but bears had a bit more in them .... last 2 days show break up in price;

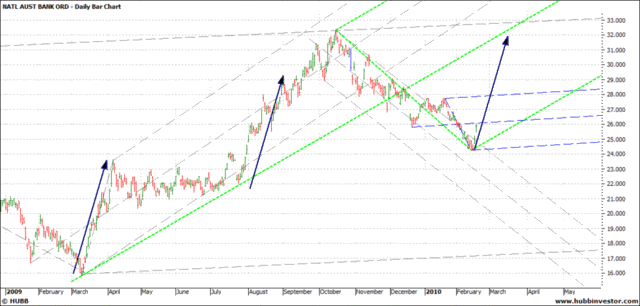
So how to define the "two day rally"???; will we follow the larger green p/f up ... I like this p/f, has the touch of med line in july 09 (a personal favorite!!!) and its almost parallel to the 09 rally p/f. If you add a "Robbbb speed angle" (bottom chart) it would project a median line cross in about mid march at a price of $32 .... OR are we going to follow a sideways consolidation??? (blue p/f)


Love the p/f!!!
As always appreciate ANY and all feedback (+ or -) ... & if master Robbb comments would make an amateur chartists day!!! LOL
GJ
- Forums
- ASX - By Stock
- NAB
- axa takeover
axa takeover, page-21
-
- There are more pages in this discussion • 5 more messages in this thread...
You’re viewing a single post only. To view the entire thread just sign in or Join Now (FREE)
Featured News
Add NAB (ASX) to my watchlist
 (20min delay) (20min delay)
|
|||||
|
Last
$38.65 |
Change
0.480(1.26%) |
Mkt cap ! $119.1B | |||
| Open | High | Low | Value | Volume |
| $38.08 | $38.72 | $37.96 | $111.9M | 2.908M |
Buyers (Bids)
| No. | Vol. | Price($) |
|---|---|---|
| 1 | 600 | $38.64 |
Sellers (Offers)
| Price($) | Vol. | No. |
|---|---|---|
| $38.65 | 10079 | 3 |
View Market Depth
| No. | Vol. | Price($) |
|---|---|---|
| 1 | 600 | 38.640 |
| 2 | 1985 | 38.620 |
| 5 | 10456 | 38.600 |
| 1 | 1408 | 38.580 |
| 2 | 9762 | 38.570 |
| Price($) | Vol. | No. |
|---|---|---|
| 38.650 | 10079 | 3 |
| 38.660 | 3558 | 1 |
| 38.670 | 4095 | 1 |
| 38.680 | 3798 | 1 |
| 38.690 | 3817 | 1 |
| Last trade - 16.10pm 02/09/2024 (20 minute delay) ? |
Featured News
| NAB (ASX) Chart |


