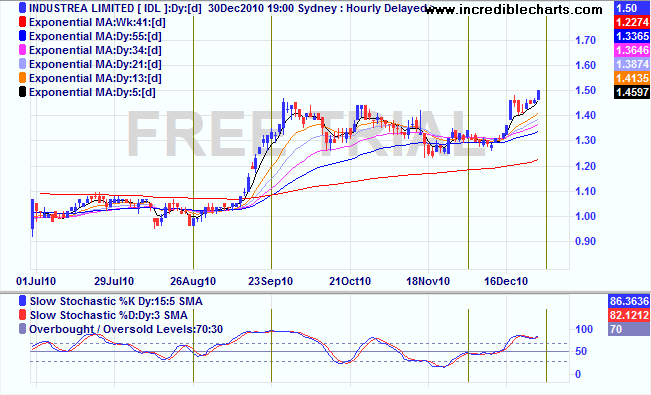
on the daily:

look at how the short to mid term ema's have compressed then fanned out upward (bordered by the vertical lines on right side) with the slow stochs flicking up very strongly last few days
compare to the last period (bordered by vertical lines) when ema's compressed then fanned out with stoch's similarly crossing
also note that the first period occured after IDL organised some debt restructure, I believe if my memory serves me correctly it was an extension of a conv note facility that gave major breathing room or was it a conversion of note debt to shares? somebody correct me ....... at the moment it seems again IDL is dealing with debt however this time it appears recent cap raise $$$ will be used to pay down debt as valley longwall has gone to some chinese... perhaps both trends up correlated with debt issue resolution, I could be wrong...
on the mid-term weekly:
while this week is obviously not over, if we close the week with a bar over the horizontal medium term resistance line (there are older potentially less relevant highs) we are in a very very good place
these charts are verhy basic to say the least but they give an idea where we're heading IMO
Add to My Watchlist
What is My Watchlist?


