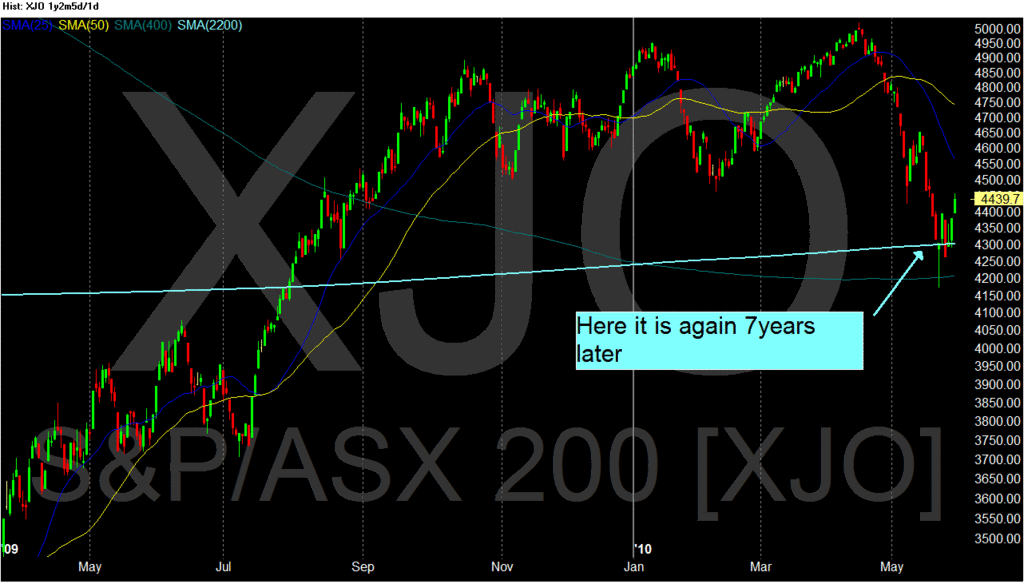
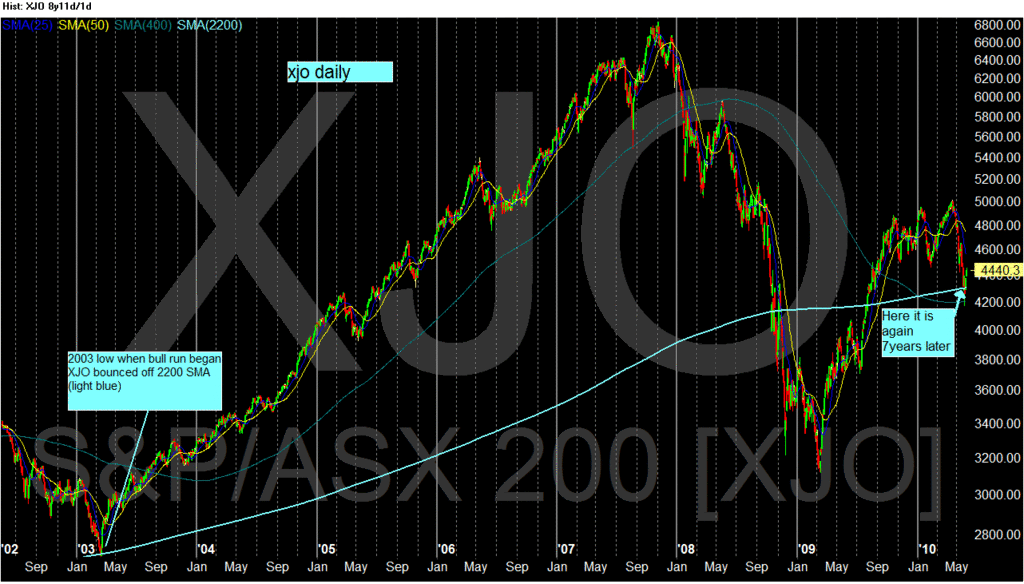
I love playing with moving averages, and for every hundred hours play I might get 1 hour's enlightenment. Sometimes.
This may mean absolutely nothing, or be quite meaningful. I haven't worked it out yet, and perhaps others more clever than me might lend their hand.
That light blue 2200 day sma caught the 2003 low which heralded the run to 2007. The darker 400 day sma caught the 2007 low and May 2008 high.
They have never met in the last 10 years ---until now, and caught the last few days' action.
Wide shot and close up:
- Forums
- ASX - By Stock
- XJO
- beautiful friday
beautiful friday, page-42
Featured News
Add XJO (ASX) to my watchlist
 (20min delay) (20min delay)
|
|||||
|
Last
8,285.2 |
Change
61.200(0.74%) |
Mkt cap ! n/a | |||
| Open | High | Low |
| 8,224.0 | 8,285.2 | 8,224.0 |
Featured News
| XJO (ASX) Chart |
The Watchlist
ACW
ACTINOGEN MEDICAL LIMITED
Will Souter, CFO
Will Souter
CFO
Previous Video
Next Video
SPONSORED BY The Market Online


