-----The GOOD, the BAD....the UGLY -----
The GOOD
*Fundamentals could not be better. And at 2009 earnings and today's PE ratio, SP would be $70+
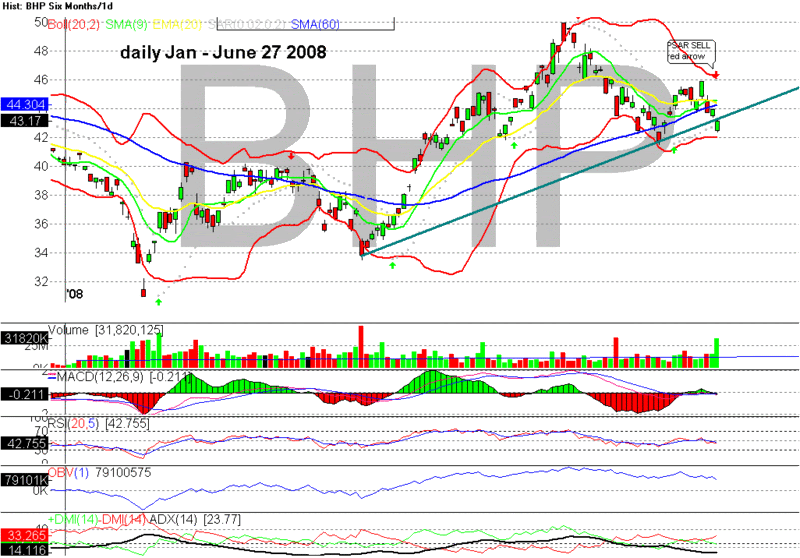
*With the exception of Wednesday,all candles this week are green, indicating the price has bounced off its low to close higher.
*SP has held above $41.70, the 50% Fibonacci retrace drawn between March low and May high
*Worth repeating, Fundamentals could not be better.
The BAD
*Even though we are closing near the day's highs, price is falling, from a high near $46 on Tuesday.
*BHP is being lumped in with the general sick market
*SP is below the 9, 20, 60 day trend line
The UGLY
*Every day the chart looks more like a head and shoulder formation
*SP is now BELOW the line from March low to June 6 low
*Indicators are negative
*Parabolic SAR indicated a SELL today for the first time since May 21.
- Forums
- ASX - By Stock
- BHP
- best stock in the universe
best stock in the universe, page-36
Featured News
Add BHP (ASX) to my watchlist
 (20min delay) (20min delay)
|
|||||
|
Last
$42.78 |
Change
0.140(0.33%) |
Mkt cap ! $217.0B | |||
| Open | High | Low | Value | Volume |
| $42.25 | $42.97 | $42.14 | $223.0M | 5.233M |
Buyers (Bids)
| No. | Vol. | Price($) |
|---|---|---|
| 4 | 10160 | $42.77 |
Sellers (Offers)
| Price($) | Vol. | No. |
|---|---|---|
| $42.79 | 5000 | 1 |
View Market Depth
| No. | Vol. | Price($) |
|---|---|---|
| 1 | 600 | 42.770 |
| 2 | 149 | 42.750 |
| 1 | 5 | 42.720 |
| 2 | 1023 | 42.700 |
| 1 | 1 | 42.510 |
| Price($) | Vol. | No. |
|---|---|---|
| 42.850 | 5000 | 1 |
| 42.900 | 4300 | 3 |
| 42.920 | 460 | 1 |
| 42.950 | 500 | 1 |
| 42.960 | 200 | 1 |
| Last trade - 16.10pm 01/11/2024 (20 minute delay) ? |
Featured News
| BHP (ASX) Chart |


