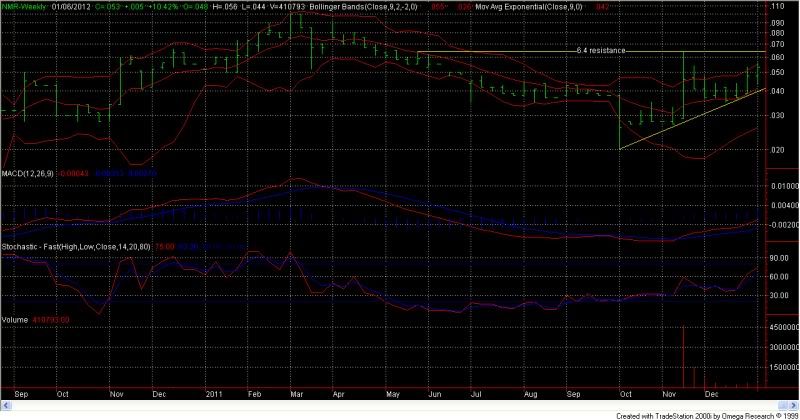
Weekly chart observations..
Bollinger bands are overbought.
Momentum (0.02) is indicating an overbought market.
Rate of Change (89.29) indicates an overbought market.
RSI is somewhat overbought at 60.40.
The sp has reached a 9 bar new high without confirmation from the Williams' A/D, suggesting that a decline is likely.
Average True Range just reached an 18 bar high, offering some evidence that a top is forming here..
A bearish st outlook is appropriate for the Money Flow indicator.
MACD is in bearish territory, but the recent upturn in the average may indicate a short term rally within the next few weeks.
The recent advances in OBV gives some indication of a pending rise, but it’s currently neutral.
SP is trading above the weekly EMA and above the linear regression value.
Volatility is in an uptrend based on a 9 bar MA.
The volume oscillator is overall bullish.
The parabolic is in bullish territory and came within 0.02 points of reaching the parabolic SAR, showing some strengthening in the uptrend. (currently long)
TRIX (-120.65) indicates an oversold market condition.
DMI is in bullish territory.
The long term trend based on a 45 bar MA is down, but an observation on a 50 bar MA shows that it has just changed direction and is now bullish. The PercentR is greater than 60 and increasing. (rising market)
The share price failed to close above the top of the bollinger band as it did the previous week. It also didn’t break out of last week’s high. (5.3)
Going by historic events, I’m suspecting another weak start to the week to test the mid/high 4’s, with a strong(er) finish by the end. If it had closed on the week’s high, I’d think otherwise.. (void on news release?)
Just my opinion. I could be way off but I get a kick out of it nevertheless lol…
Short-term resistance levels appear to be at 5.6 and 6.4, while an open gap exists at 4.9. (on the daily chart)
Weekly
Good luck!
- Forums
- ASX - By Stock
- beyond reasonable doubt
NMR
native mineral resources holdings limited
Add to My Watchlist
5.00%
 !
19.0¢
Weekly chart observations..Bollinger bands are...
Featured News
Add to My Watchlist
What is My Watchlist?
A personalised tool to help users track selected stocks. Delivering real-time notifications on price updates, announcements, and performance stats on each to help make informed investment decisions.
 (20min delay) (20min delay)
|
|||||
|
Last
19.0¢ |
Change
-0.010(5.00%) |
Mkt cap ! $179.0M | |||
| Open | High | Low | Value | Volume |
| 20.0¢ | 20.0¢ | 18.8¢ | $207.0K | 1.072M |
Buyers (Bids)
| No. | Vol. | Price($) |
|---|---|---|
| 7 | 141932 | 18.5¢ |
Sellers (Offers)
| Price($) | Vol. | No. |
|---|---|---|
| 19.5¢ | 142313 | 3 |
View Market Depth
| No. | Vol. | Price($) |
|---|---|---|
| 7 | 127584 | 0.185 |
| 5 | 90199 | 0.180 |
| 3 | 146223 | 0.175 |
| 2 | 411764 | 0.170 |
| 5 | 202121 | 0.165 |
| Price($) | Vol. | No. |
|---|---|---|
| 0.195 | 217250 | 3 |
| 0.200 | 96026 | 4 |
| 0.205 | 30622 | 3 |
| 0.210 | 50000 | 1 |
| 0.220 | 74993 | 2 |
| Last trade - 14.43pm 24/06/2025 (20 minute delay) ? |
Featured News
| NMR (ASX) Chart |


