Evening Jermaynew, long time no speak.
BHP chart shows it could struggle in the short term.
You want a good put option, but really a better play would be a covered call, in my opinion of course.
BHP has next support at $34. This is the last previous bounce point and the fibonacci 38.2% retracement level.
If that were to fail, then you get support at $29 - which is the 50% fibonacci retracement and also the region of the longer term up sloping trendline.
If you were to write say a dec $40 call option, you would receive around $1-85 per share based on todays last trade.
I dont know your entry price, but if you were exercised, you would in fact be selling your shares for $40 + $1.85 =$41.85.
If you are not exercised then you make $1-85 per share, and can simply write another covered call if you wish.
There is some pretty serious overhead resistance at $42 on the chart, so this strategy would probably see you retain your shares, or at least part with them at the best shorter term price I believe.
Good luck, hope this helps.
Cheers
Commy
Daily Chart looks like this, sorry the chart is zoomed out to show long term trend line.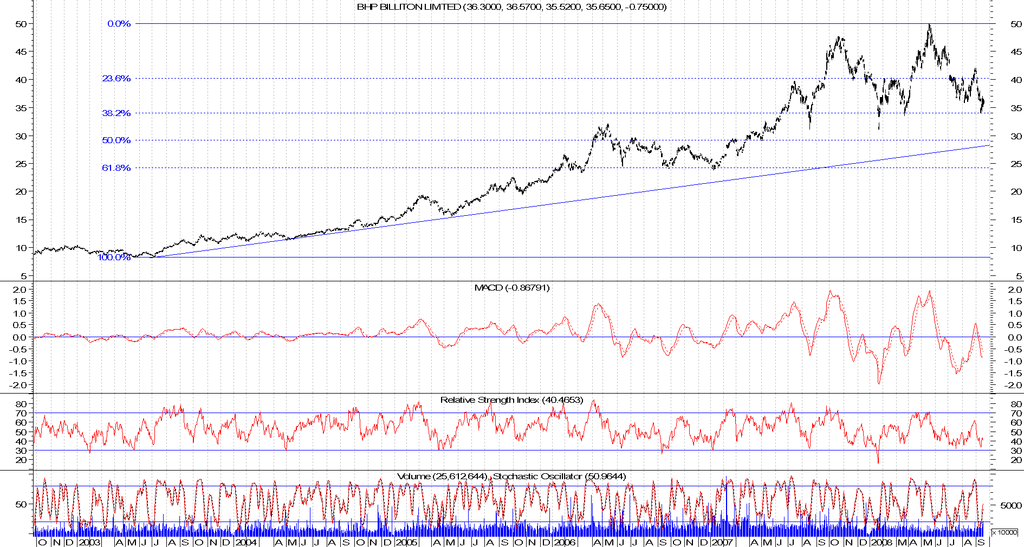
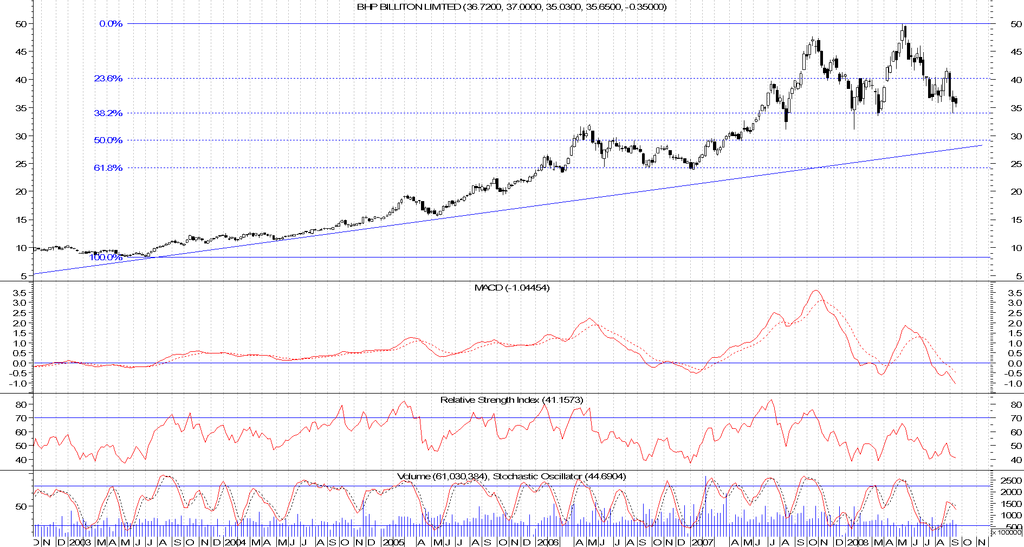
Weekly Chart looks like this
Evening Jermaynew, long time no speak.BHP chart shows it could...


Add BHP (ASX) to my watchlist
 (20min delay) (20min delay)
|
|||||
|
Last
$42.78 |
Change
0.030(0.07%) |
Mkt cap ! $216.9B | |||
| Open | High | Low | Value | Volume |
| $42.92 | $43.08 | $42.62 | $778.2M | 18.12M |
Buyers (Bids)
| No. | Vol. | Price($) |
|---|---|---|
| 1 | 3000 | $42.77 |
Sellers (Offers)
| Price($) | Vol. | No. |
|---|---|---|
| $42.81 | 119112 | 3 |
View Market Depth
| Last trade - 16.10pm 21/06/2024 (20 minute delay) ? |
| BHP (ASX) Chart |