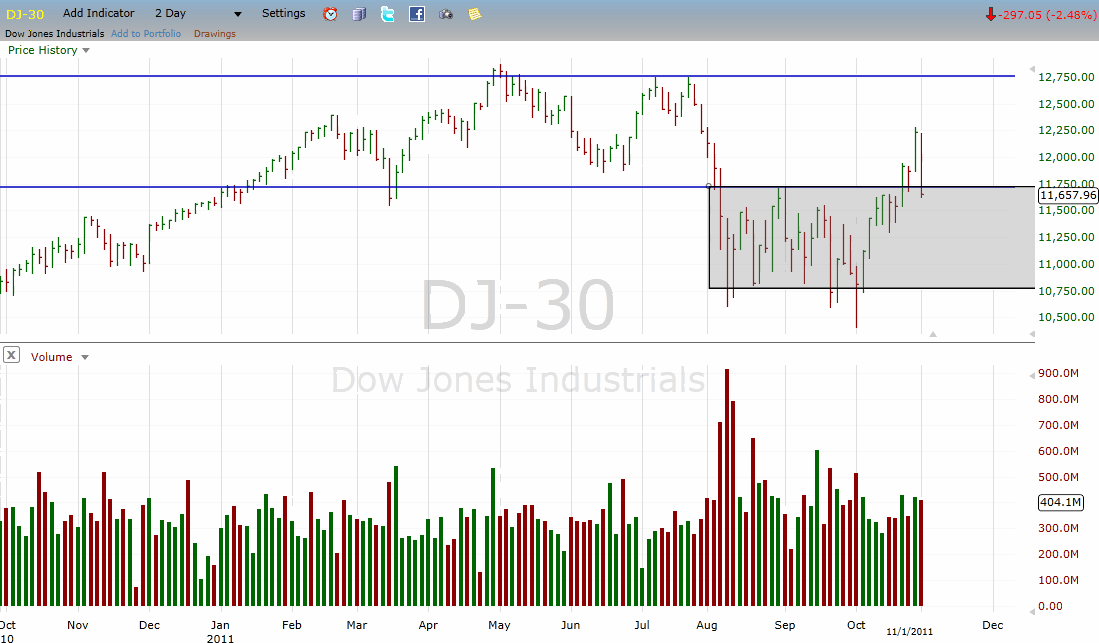
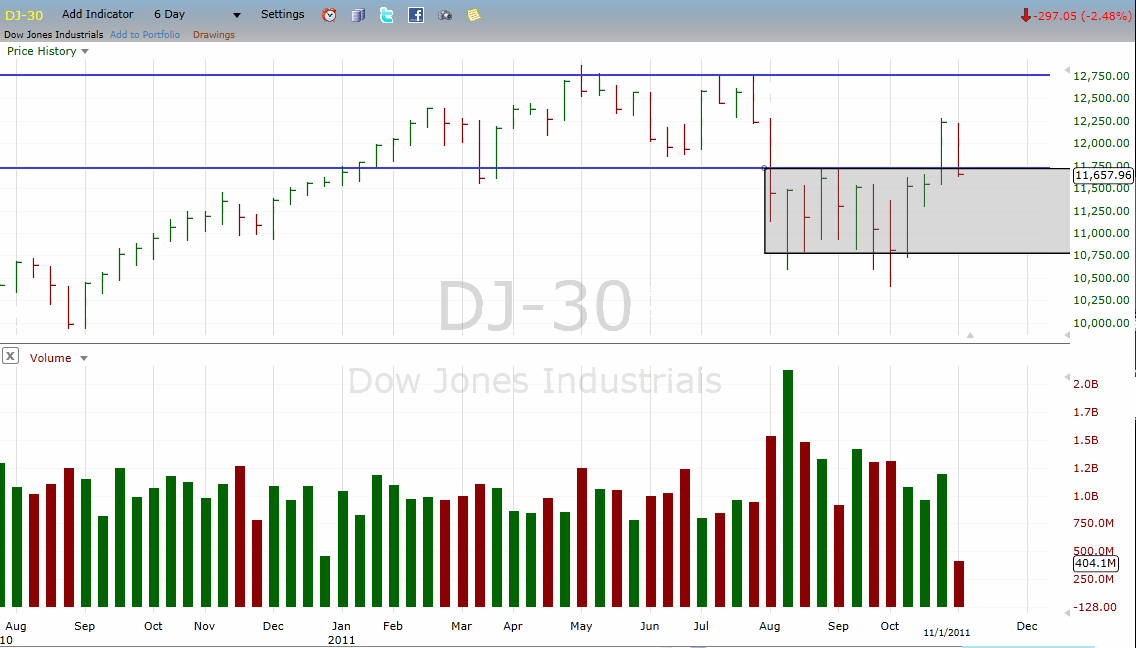
2 DJIA charts
First up is one that has 2day bars, and it’s plainly obvious to all, that’s a mean looking top reversal, locked in all buyers of the recent breakout move above the trading range
Next is a longer term chart with its live bar still having 4more trading days to close, and after a kind of nice SOS busting out of the Trading range, we can see that with another 4days to complete this current bar its certainly NOT going to be a successful backtest, too much volume to begin with and too wide a spread, let’s see where we finish up
Also those blue horizontal trend lines are from S/R levels of a redistribution phase back in 2008
- Forums
- ASX - By Stock
- XJO
- biggdaddy's wow wednesday
biggdaddy's wow wednesday, page-13
-
- There are more pages in this discussion • 183 more messages in this thread...
You’re viewing a single post only. To view the entire thread just sign in or Join Now (FREE)
Featured News
Add XJO (ASX) to my watchlist
 (20min delay) (20min delay)
|
|||||
|
Last
8,013.4 |
Change
31.000(0.39%) |
Mkt cap ! n/a | |||
| Open | High | Low |
| 7,982.4 | 8,030.3 | 7,982.4 |
Featured News
| XJO (ASX) Chart |


