Hey are you setting me up or what ? lol
seems you have a good grasp on this stocks trading patterns and fundamentals.Bot trades are also disconcerting...
Anyway its actually quite TA compliant to date
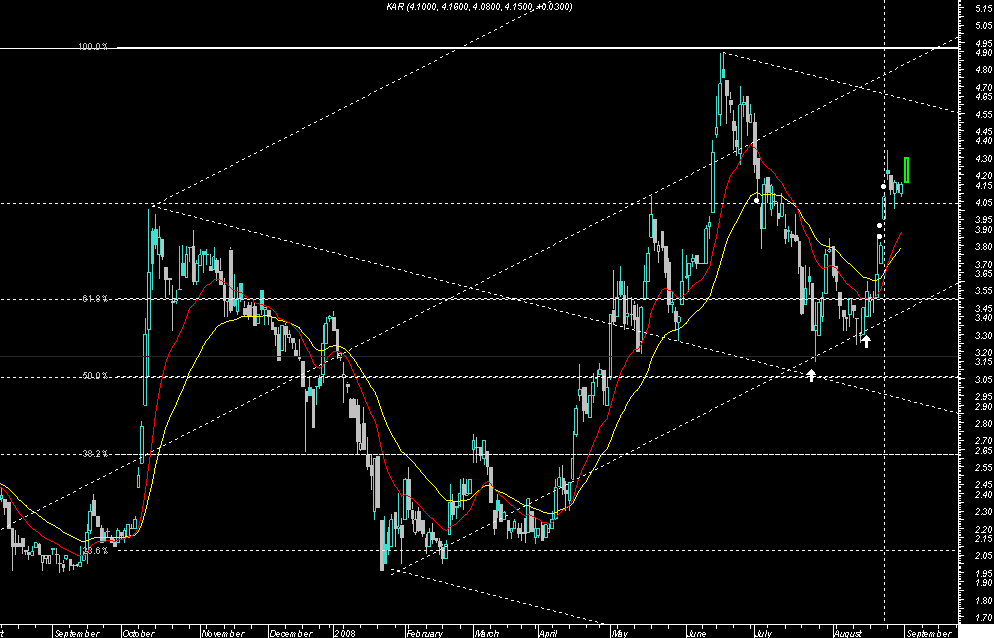
unfortunately it has just left its first gap to date
and todays volumes just dont have enough momentum to have a crack at the 434 resistance.. This would be a pennant break out point...It has run well and is overbought atm and one would have expected more sideways accumulation than todays rise..so its back to your Fundamental speculation to fathom that one out..I know SFA
worst case is a retrace to 390 however a tight trailing stoploss close to the 405 fib would be worth considering imo
So to summarise my chart view was it should not have risen today and I was wrong...you can Take this chart with a dose of salts...lol
Jokes aside let it run but use a sensible stoploss...
other chartists help or views would be nice...
My last sell trigger is the broken vertical line ??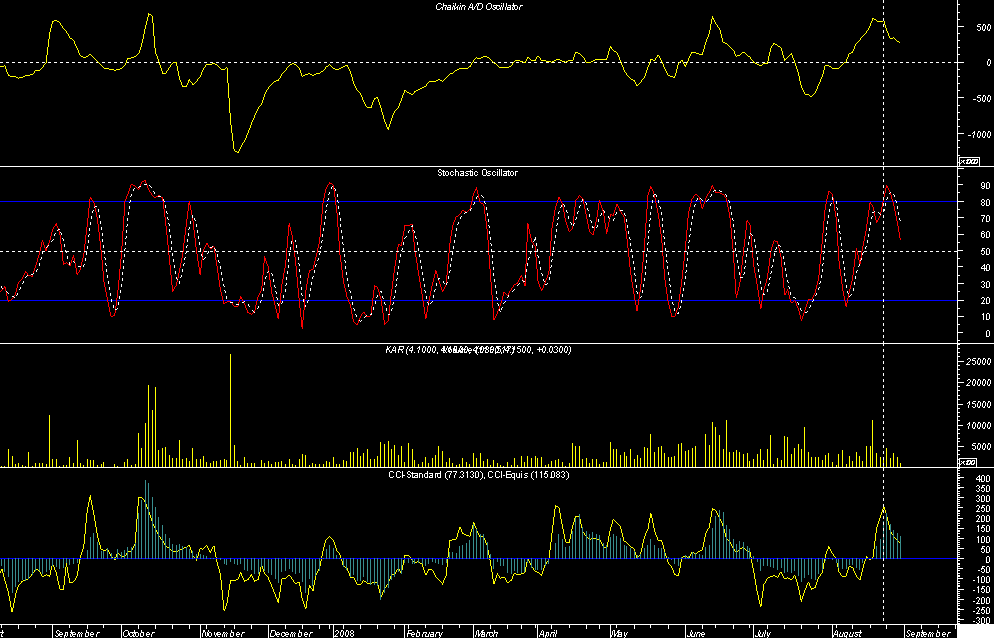
black swan chart


Add KAR (ASX) to my watchlist
 (20min delay) (20min delay)
|
|||||
|
Last
$1.72 |
Change
0.060(3.61%) |
Mkt cap ! $1.378B | |||
| Open | High | Low | Value | Volume |
| $1.67 | $1.73 | $1.67 | $18.60M | 10.89M |
Buyers (Bids)
| No. | Vol. | Price($) |
|---|---|---|
| 3 | 48682 | $1.72 |
Sellers (Offers)
| Price($) | Vol. | No. |
|---|---|---|
| $1.73 | 130076 | 5 |
View Market Depth
| Last trade - 16.10pm 21/06/2024 (20 minute delay) ? |
| KAR (ASX) Chart |