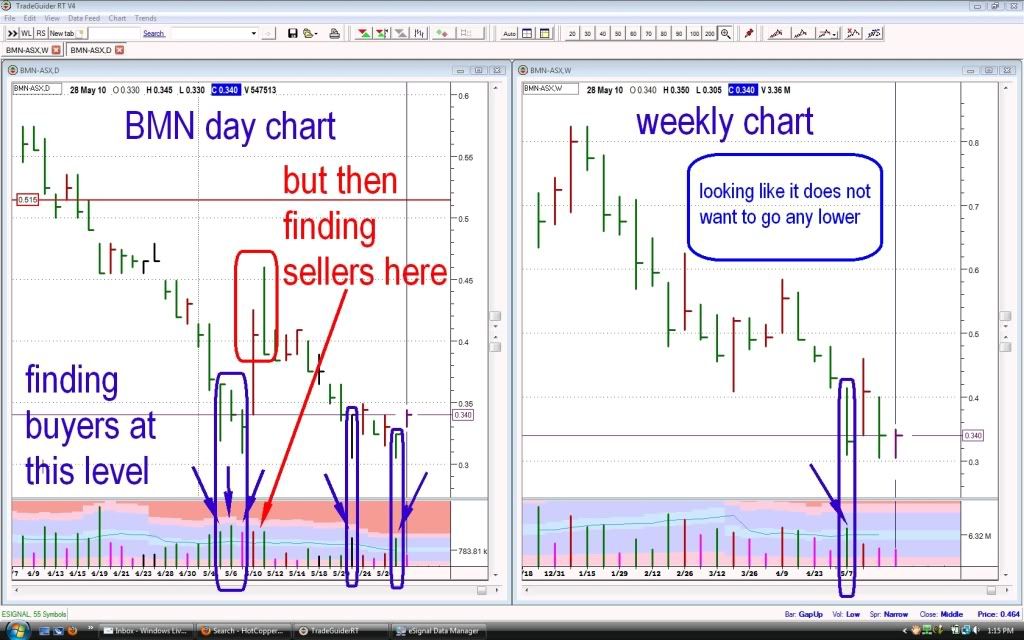
BMN appears to be holding up quite well over the last few weeks. There appears to be buying support around the mid low 30cents and this can be seen by the high volume on each of those down days ( coloured green/black ) and most of those days are finishing on the highs ( big plus ).
Now saying that if we look at the daily chart we can also see that the 2days that are highlighted red is when the selling/offloading occurred - THIS is a perfect text book example of how they do it -
You may be able to see the big high volume bar ( coloured red) on the 10May does not close on the top ( selling ) and then the next day they take it up even higher bringing in more buyers and then SLAMMING the door closed on your fingers by closing it on the days lows - then they stand aside - this can be seen by the low volume for the next three days - called walking the plank and then it breaks down rapidly before the same ones that were doing all the selling start buying back from the now exiting buyers of a week earlier, this can be seen with the increase in volume on that level closing ( black ) day.
Note on the weekly we have potential strength behind us and for the last two weeks we have basically closed similar on decreasing volume ( very good ). if it wasn't for the Europeans BMN is looking like a very low risk entry, if considering one maybe only buy on the break on last weeks highs and also remember where that weakness is sitting just above the 40cent level.
- Forums
- ASX - By Stock
- BMN
- bmn 28may charts
BMN
bannerman energy ltd
Add to My Watchlist
1.16%
 !
$3.50
bmn 28may charts
Featured News
Add to My Watchlist
What is My Watchlist?
A personalised tool to help users track selected stocks. Delivering real-time notifications on price updates, announcements, and performance stats on each to help make informed investment decisions.
 (20min delay) (20min delay)
|
|||||
|
Last
$3.50 |
Change
0.040(1.16%) |
Mkt cap ! $718.9M | |||
| Open | High | Low | Value | Volume |
| $3.37 | $3.56 | $3.37 | $14.32M | 4.085M |
Buyers (Bids)
| No. | Vol. | Price($) |
|---|---|---|
| 1 | 500 | $3.49 |
Sellers (Offers)
| Price($) | Vol. | No. |
|---|---|---|
| $3.54 | 1000 | 1 |
View Market Depth
| No. | Vol. | Price($) |
|---|---|---|
| 1 | 500 | 3.490 |
| 1 | 2000 | 3.420 |
| 1 | 160 | 3.400 |
| 1 | 1474 | 3.370 |
| 1 | 6060 | 3.300 |
| Price($) | Vol. | No. |
|---|---|---|
| 3.540 | 1000 | 1 |
| 3.580 | 6000 | 1 |
| 3.600 | 7000 | 3 |
| 3.630 | 8771 | 1 |
| 3.640 | 1123 | 3 |
| Last trade - 16.10pm 19/09/2025 (20 minute delay) ? |
Featured News
| BMN (ASX) Chart |


