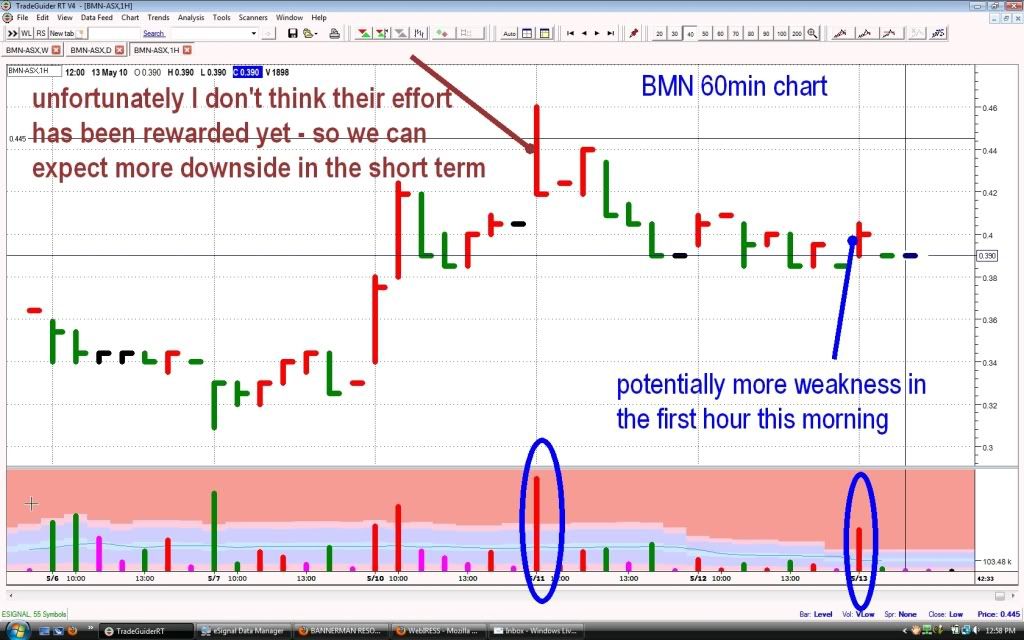
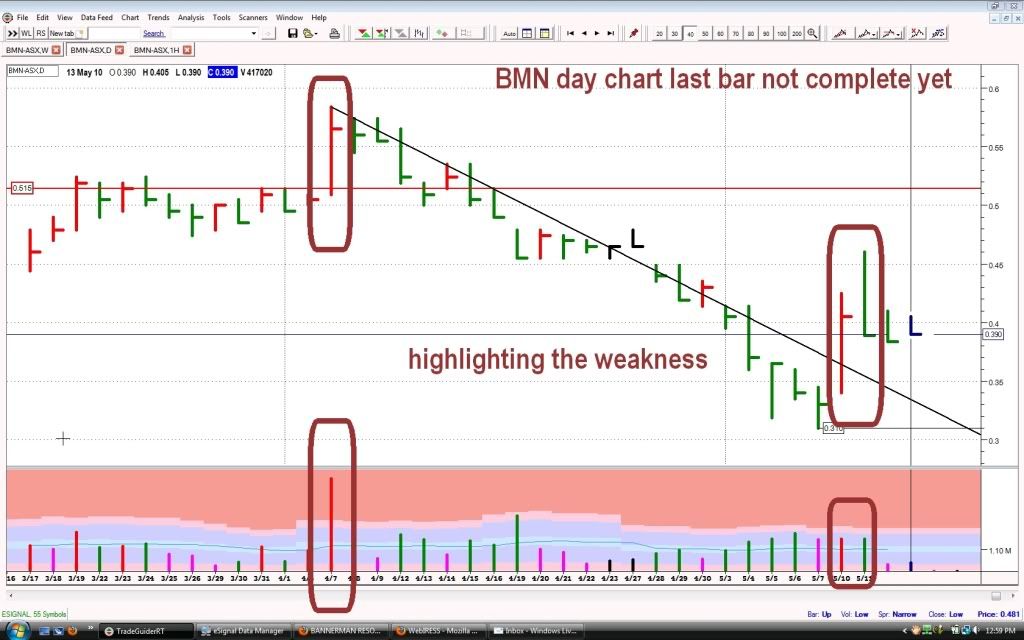
Unfortunately some more potential weakness turned up in the first hour of this morning, I have posted a 60min and day chart of BMN, quite possibly more downside is to come in the short term because imo their effort from several days ago has not been rewarded yet, hopefully I'm wrong. P.S. all long term holders please ignore this post.

- Forums
- ASX - By Stock
- BMN
- bmn chart 13may
BMN
bannerman energy ltd
Add to My Watchlist
1.16%
 !
$3.50
bmn chart 13may
Featured News
Add to My Watchlist
What is My Watchlist?
A personalised tool to help users track selected stocks. Delivering real-time notifications on price updates, announcements, and performance stats on each to help make informed investment decisions.
 (20min delay) (20min delay)
|
|||||
|
Last
$3.50 |
Change
0.040(1.16%) |
Mkt cap ! $718.9M | |||
| Open | High | Low | Value | Volume |
| $3.37 | $3.56 | $3.37 | $14.32M | 4.085M |
Buyers (Bids)
| No. | Vol. | Price($) |
|---|---|---|
| 1 | 500 | $3.49 |
Sellers (Offers)
| Price($) | Vol. | No. |
|---|---|---|
| $3.54 | 1000 | 1 |
View Market Depth
| No. | Vol. | Price($) |
|---|---|---|
| 1 | 500 | 3.490 |
| 1 | 2000 | 3.420 |
| 1 | 160 | 3.400 |
| 1 | 1474 | 3.370 |
| 1 | 6060 | 3.300 |
| Price($) | Vol. | No. |
|---|---|---|
| 3.540 | 1000 | 1 |
| 3.580 | 6000 | 1 |
| 3.600 | 7000 | 3 |
| 3.630 | 8771 | 1 |
| 3.640 | 1123 | 3 |
| Last trade - 16.10pm 19/09/2025 (20 minute delay) ? |
Featured News
| BMN (ASX) Chart |


