Hi Saylor,
Yes still in BOL, got some more at 25cents the other day and then missed some at 20cents on Thurs, bummer.
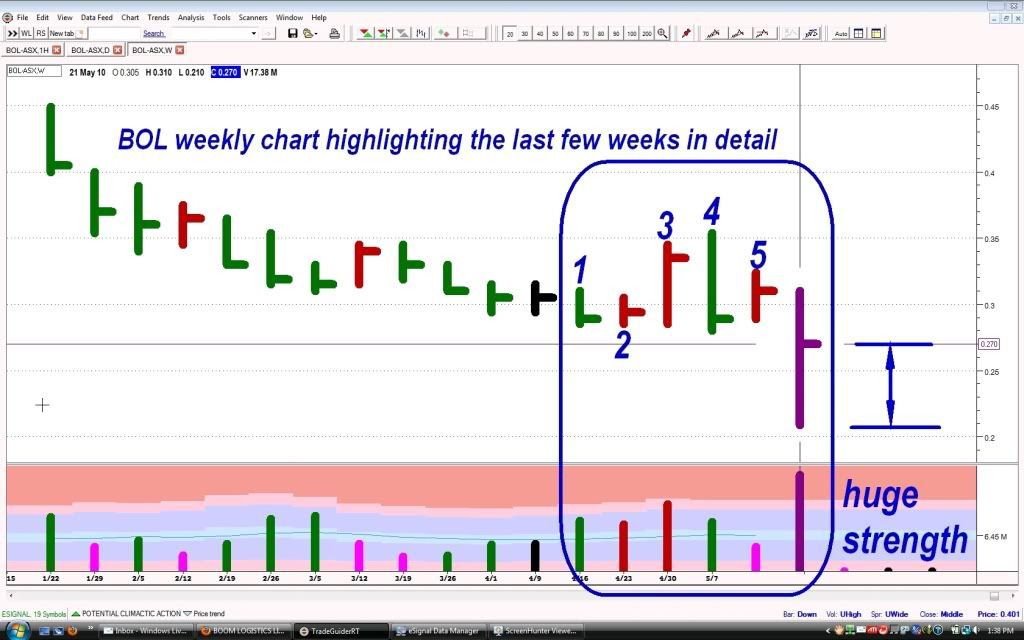
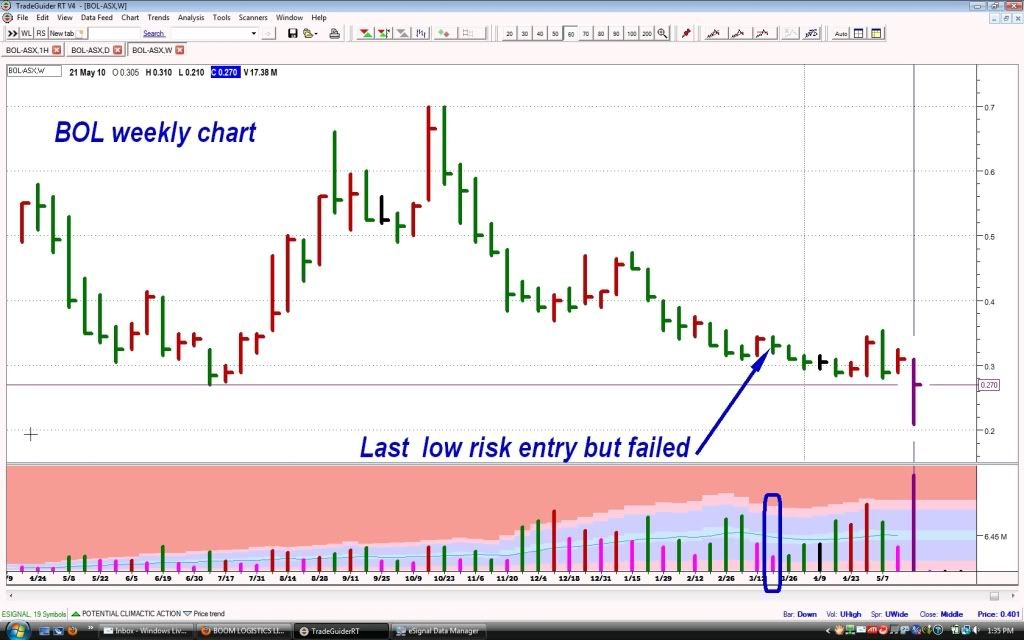
Here are two updated weekly charts of BOL, the first one is a close up of the last few months and in particular the last 6weeks.
As you may know by now one way for going long on a stock is wait for strength to appear and then buy when all of the selling has stopped and there are no signs of weakness around.
On the chart we can see that the only low risk entry was back on the 19Mar and it failed, use a stop loss and no worries.
Bar No1. on the chart is a high volume down week - an increase in selling cause it made new lows.
NO2. is a high volume up week - we always consider these ones suss so be wary
NO3. is a very high volume up week which in hindsight would have caught a lot of breakout traders, always consider these suss cause of hidden offloading
NO4. is a perfect example of a top reversal - see how it made a higher high - encouraged more buyers - and also made a lower low and finished close to the bottom - trapping all those breakout buyers in for a loss
NO5. is the next nail in the coffin - the main players have stood aside and are just waiting for the weakness to flow thru - a low volume up bar
A big positive here is the amount of support/strength that can be seen from last week, there are a lot of buyers down there in the low twenties.

- Forums
- ASX - By Stock
- BOL
- bol 21may weekly chart
bol 21may weekly chart
-
- There are more pages in this discussion • 7 more messages in this thread...
You’re viewing a single post only. To view the entire thread just sign in or Join Now (FREE)
Featured News
Add BOL (ASX) to my watchlist
 (20min delay) (20min delay)
|
|||||
|
Last
13.5¢ |
Change
-0.005(3.57%) |
Mkt cap ! $57.04M | |||
| Open | High | Low | Value | Volume |
| 13.8¢ | 14.0¢ | 13.5¢ | $6.826K | 50.54K |
Buyers (Bids)
| No. | Vol. | Price($) |
|---|---|---|
| 5 | 219545 | 13.5¢ |
Sellers (Offers)
| Price($) | Vol. | No. |
|---|---|---|
| 14.0¢ | 708756 | 5 |
View Market Depth
| No. | Vol. | Price($) |
|---|---|---|
| 5 | 219545 | 0.135 |
| 1 | 405000 | 0.130 |
| 3 | 211000 | 0.125 |
| 3 | 18340 | 0.120 |
| 1 | 4770 | 0.105 |
| Price($) | Vol. | No. |
|---|---|---|
| 0.140 | 708756 | 5 |
| 0.145 | 956695 | 5 |
| 0.150 | 678907 | 8 |
| 0.155 | 879727 | 6 |
| 0.160 | 2139986 | 6 |
| Last trade - 16.10pm 30/08/2024 (20 minute delay) ? |
Featured News
| BOL (ASX) Chart |
The Watchlist
CCO
THE CALMER CO INTERNATIONAL LIMITED
Anthony Noble, MD & CEO
Anthony Noble
MD & CEO
Previous Video
Next Video
SPONSORED BY The Market Online


