Gold Correction Implications For The Path Forward
As I pen this article, gold and gold stocks may be starting to form a low.
Over the past four trading days, GDX and GDXJ have dug in and formed bullish reversal candles, while gold has traded lower and tested its 38% retracement at $1690.
Gold traded as low as $1683 on Friday. I would love to see gold test lateral support at $1675 or even quarterly support at $1660 while the gold stocks continue to hold. That would strengthen the signal of a low.
The good news is we are approaching a low and are likely to rally in the spring.
However, this correction has gone further and longer than I anticipated.
Last summer, when the correction began, I gave subscribers the worst-case scenario target of $1690. I expected GDX and GDXJ could bottom around $33-$34 and $48-$50.
I expected 2021 would be a grind, but I also anticipated it would be more of a consolidation than a severe correction.
As a result, the historical comparisons have shifted.
The current declines in the HUI and GDXJ, which are around 30% top to bottom, somewhat resemble those from 2004 and 2016. During those corrections, GDXJ and HUI corrected 38% and 37% in 2004, and then each corrected 42% in 2016. The length of the three corrections was similar.
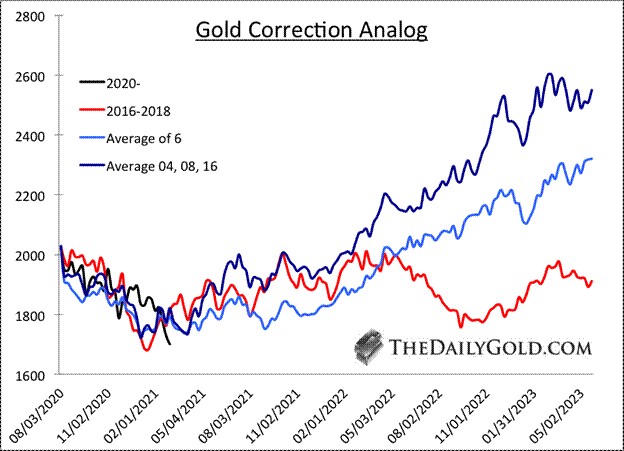
As for gold, there is no single best comparison, but the 2016 and 2004 corrections stand out.
In the chart below, we plot, on the current correction scale, the 2016 to 2018 correction, an average of six historical corrections (including 1975-1976 and 1999-2001) and three comparable corrections (2004, 2008, 2016-2018).
As you can see, the only outlier is the 2016-2018 correction, which began its next impulsive advance in September 2022. The others did so in early 2022.
The similarity to 2016 is rising yields caused the correction, but the difference is the Fed was hiking rates until the end of 2018. At present, the Fed will not hike rates anytime soon, and there is also the added potential for more fiscal support.
While the big picture fundamentals are very bullish, the macro fundamentals for this year are not as bullish, as explained here.
Gold's recent underperformance signaled that, while inflation is rising, the market does not expect it to accelerate this year. Hence, the decline in real interest rates would stop.
Also, gold's underperformance was a signal of a coming rebound in the US Dollar…and likely correction in other commodities. The rebound in the dollar has gained traction…and other metals are selling off sharply.
Gold's next impulsive leg higher will not begin until the market senses acceleration in inflation or bond yields decline significantly due to a sharp correction in the stock market.
These things are not too far off, but the market is telling us neither will happen in the next six to nine months.
The upshot to this is gold and gold stocks have already discounted most of these negative developments. Markets look forward. They anticipate…and they discount in advance.
In addition, junior gold and silver companies are on their way to having the best value since the Covid crash. High-quality juniors have corrected 30% to 40%, while some decent-quality juniors are off 50% to 60%.
This correction sets up many juniors to be 5, 7, and 10 baggers over the next two to three years.
But this year is going to be a grind. You have to buy weakness…and you have to have patience. Moreover, you should never lose more than 20% on a single stock. Cut your losses