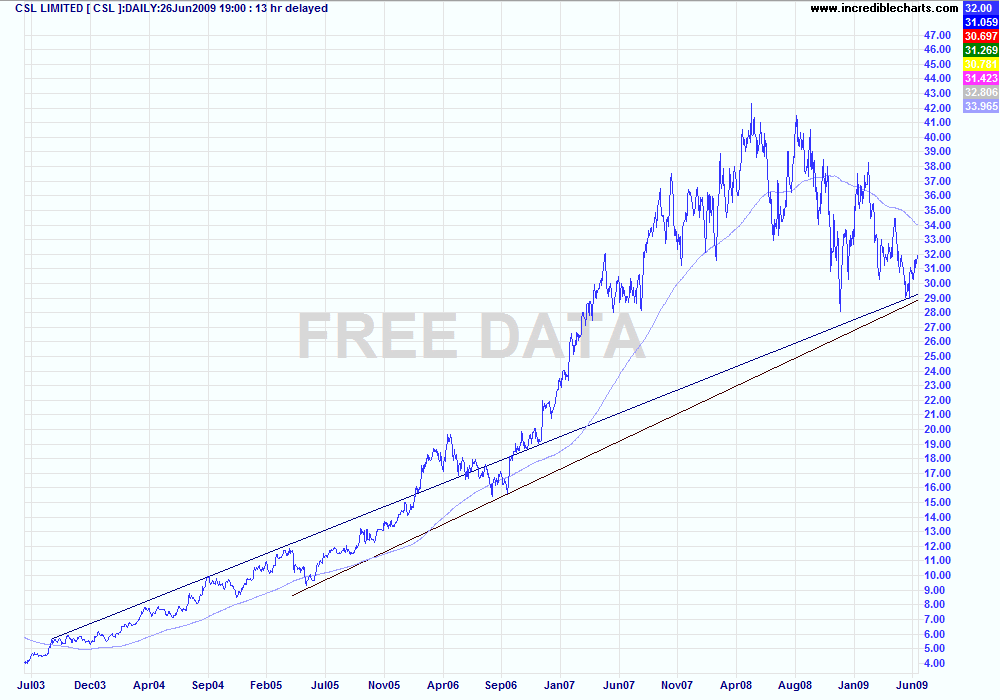
Oh, and one other chart to add to this thread, this one also based on the daily for the full bull market.
Early stage of bull market we had a resistance line formed between Aug 03 and Sep 04. This was broken twice during the uptrend, first time in Feb 06 and again in Oct 06, since Oct 06 we have not closed below this line, on 29 May 09 we went below this line intra-day but that formered the touch on the other trend line mentioned in this thread but we closed above the line. On June 5 2009, when we formed our lower high, we closed on this uptrend line. So that one little period has now hit and bounced off two long term lines.

Again, all just for fun. I don't claim to be a chartist, just trying to slowly learn. Currently I am only playing with trend lines and support lines, given up on flags, pennants and all that funky kind of stuff for now, found them all too confusing :) I am sure for this length of time I should be using log price scale, but hey, if it works with normal then so be it :P
- Forums
- ASX - By Stock
- CSL
- bull market history
bull market history, page-28
-
- There are more pages in this discussion • 6 more messages in this thread...
You’re viewing a single post only. To view the entire thread just sign in or Join Now (FREE)
Featured News
Add CSL (ASX) to my watchlist
 (20min delay) (20min delay)
|
|||||
|
Last
$311.12 |
Change
3.100(1.01%) |
Mkt cap ! $150.3B | |||
| Open | High | Low | Value | Volume |
| $308.75 | $311.12 | $306.32 | $220.9M | 712.8K |
Buyers (Bids)
| No. | Vol. | Price($) |
|---|---|---|
| 1 | 1100 | $310.80 |
Sellers (Offers)
| Price($) | Vol. | No. |
|---|---|---|
| $311.13 | 1131 | 2 |
View Market Depth
| No. | Vol. | Price($) |
|---|---|---|
| 1 | 1100 | 310.800 |
| 1 | 906 | 310.030 |
| 1 | 6 | 310.000 |
| 1 | 71 | 309.980 |
| 1 | 400 | 309.940 |
| Price($) | Vol. | No. |
|---|---|---|
| 311.150 | 50 | 1 |
| 311.170 | 100 | 1 |
| 311.190 | 103 | 3 |
| 311.200 | 150 | 1 |
| 311.210 | 250 | 1 |
| Last trade - 16.10pm 18/07/2024 (20 minute delay) ? |
Featured News
| CSL (ASX) Chart |


