Had some time so decided to throw up charts of what I was refering to in the text.
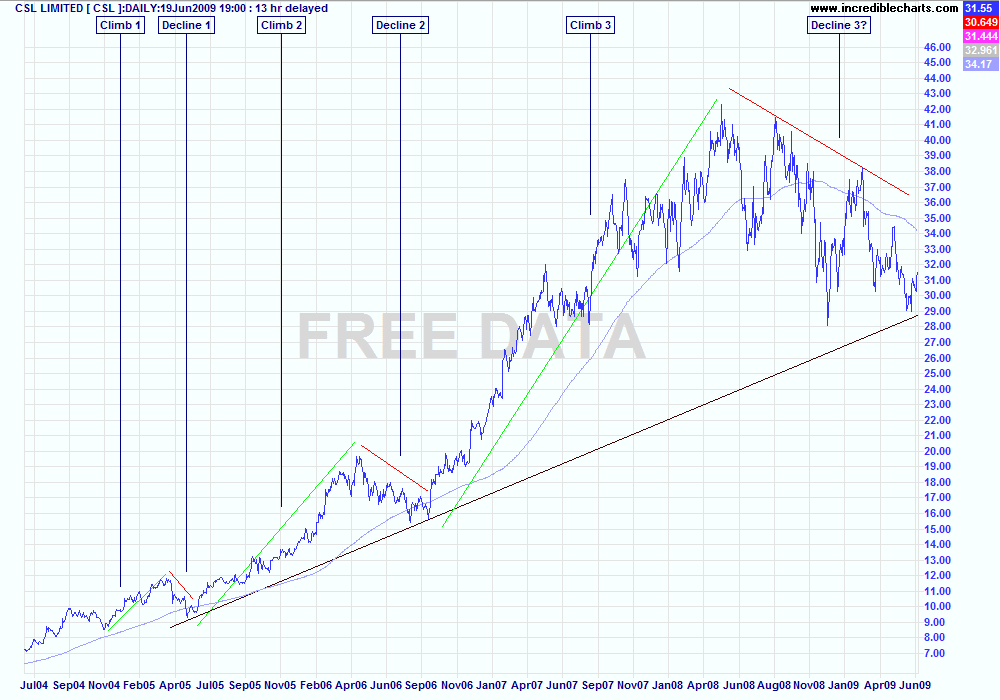
First, 6 year chart showing 200 day sma as well as a trend line between the 3 declines I am refering to.

Note that even the predecessor to climb 1 is a low/higher low combo.
In each climb we have some sideways periods, more prenounced in the last climb but this is not a surprise given the length of time.
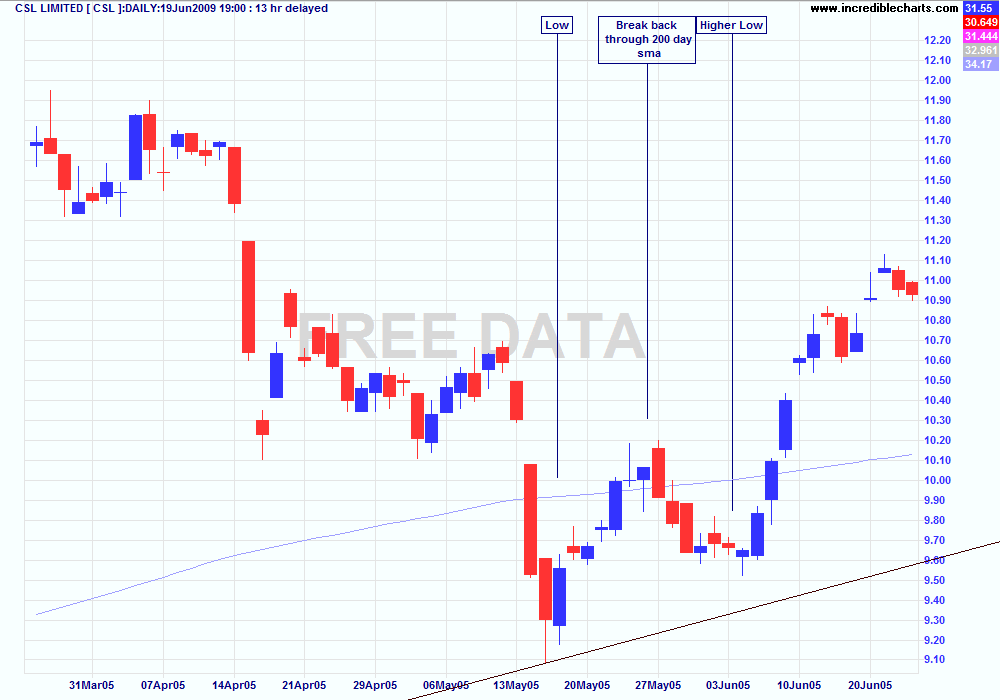
Zoom in on decline 1 - Note the start of our linked trend line as well.

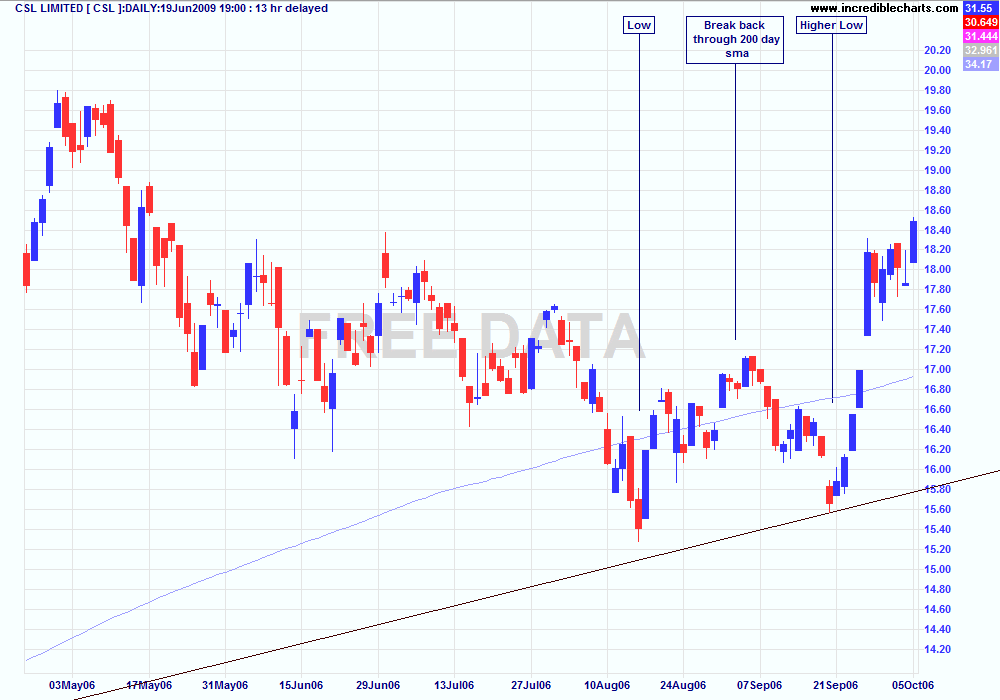
Zoom in on Decline 2 - note trend line hits intra-day low for higher low period.

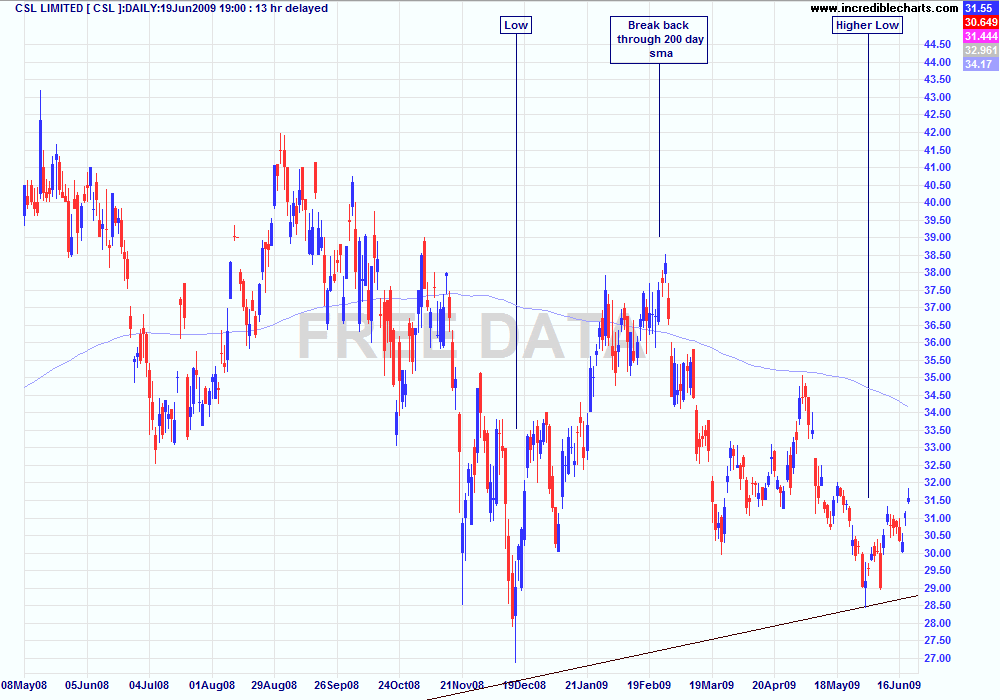
Zoom in on Decline 3 - note we get a perfect touch on our trend line with the intra-day low for the higher low period.

Main concern is the early breaks of the 200 day sma for decline 3, oh and the fact that we still have a long way to go before we beat our high of 42.33 way back on May 15 2008 and get to call this an uptrend :)
As stated in original post this may be complete bogus but I have enjoyed looking at it and even manged to get my first thumbs up with text description which encouraged me to post this chart version.
- Forums
- ASX - By Stock
- bull market history
Had some time so decided to throw up charts of what I was...
-
- There are more pages in this discussion • 25 more messages in this thread...
You’re viewing a single post only. To view the entire thread just sign in or Join Now (FREE)
Featured News
Add CSL (ASX) to my watchlist
 (20min delay) (20min delay)
|
|||||
|
Last
$305.34 |
Change
4.220(1.40%) |
Mkt cap ! $147.5B | |||
| Open | High | Low | Value | Volume |
| $303.92 | $305.98 | $302.00 | $378.0M | 1.257M |
Buyers (Bids)
| No. | Vol. | Price($) |
|---|---|---|
| 1 | 74 | $305.22 |
Sellers (Offers)
| Price($) | Vol. | No. |
|---|---|---|
| $305.43 | 250 | 1 |
View Market Depth
| No. | Vol. | Price($) |
|---|---|---|
| 1 | 100 | 302.110 |
| 1 | 86 | 302.000 |
| 1 | 160 | 301.560 |
| 1 | 30 | 301.130 |
| 2 | 36 | 301.120 |
| Price($) | Vol. | No. |
|---|---|---|
| 306.000 | 70 | 2 |
| 306.250 | 50 | 1 |
| 306.340 | 100 | 1 |
| 306.380 | 100 | 1 |
| 306.500 | 157 | 2 |
| Last trade - 16.10pm 16/08/2024 (20 minute delay) ? |
Featured News
| CSL (ASX) Chart |


