The failure of the bail out comes as a shock.....but perhaps chartists should not be so shocked. there is just something about the sacred geometry of the charts that likes to keep itself in order.
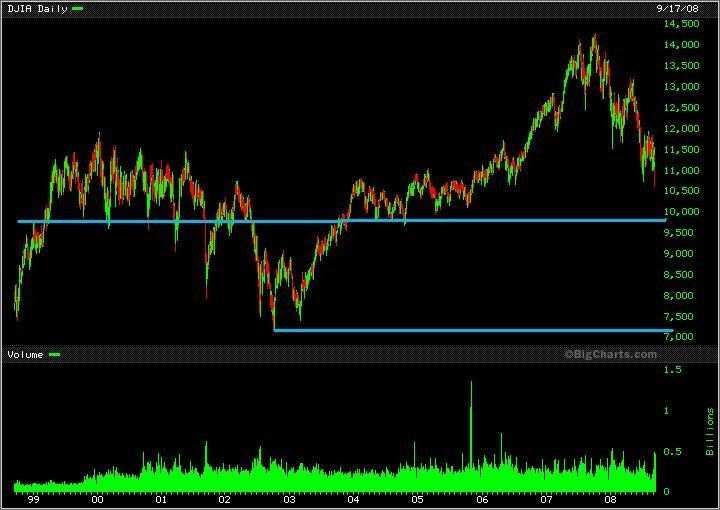
Just a tad under 9900 is a 61.8% retrace of the entire bull market. There is also horizontally a lot of chart support at that level going back to 2000. Diagonally there is support going back to 1995.
There is now less that 500 points to get there and another couple of days before congress votes again.
I would be very neat to touch that level and then bounce.... I don't think it will be the ultimate low but there could be one very big bounce
the charts below are a tad out of date but still show the point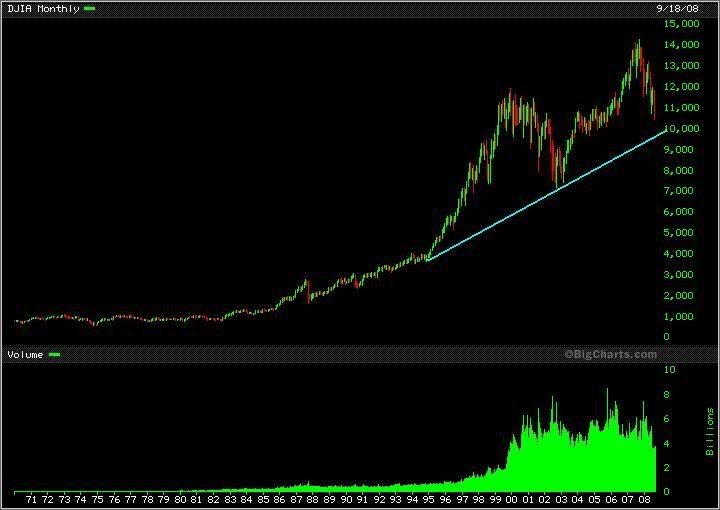
busy tuesday, page-12


Add XJO (ASX) to my watchlist
 (20min delay) (20min delay)
|
|||||
|
Last
7,777.7 |
Change
95.700(1.25%) |
Mkt cap ! n/a | |||
| Open | High | Low |
| 7,682.0 | 7,795.1 | 7,682.0 |
| XJO (ASX) Chart |