Rule number one: preview before posting. My apologies.
Take 2:
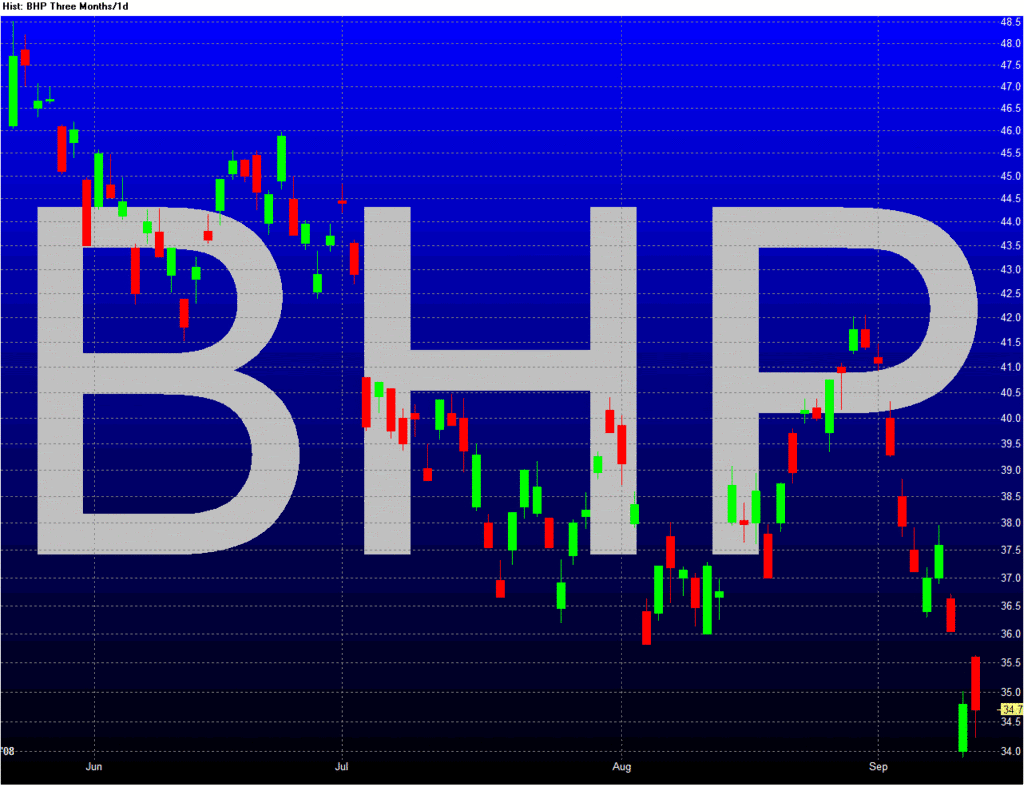
This day chart for the last few months should give you an idea what happens to the SP on green/red candle days.
Look for the length of shadows, or wicks, below the base of the green candles to see whether the price tends to fall back from the open before rising, and by how much.
Length above the green candle tells how far from the high it closed.
For red candle, length below candle tells if if closed near its lows....
No--or very tiny--wicks mean the bulls (green) were totally in charge, ditto for bears (red).
- Forums
- ASX - By Stock
- BHP
- buying on the open
buying on the open, page-13
-
-
- There are more pages in this discussion • 9 more messages in this thread...
You’re viewing a single post only. To view the entire thread just sign in or Join Now (FREE)
Featured News
Add BHP (ASX) to my watchlist
 (20min delay) (20min delay)
|
|||||
|
Last
$40.86 |
Change
0.650(1.62%) |
Mkt cap ! $207.2B | |||
| Open | High | Low | Value | Volume |
| $40.65 | $41.02 | $40.32 | $321.8M | 7.877M |
Buyers (Bids)
| No. | Vol. | Price($) |
|---|---|---|
| 1 | 1456 | $40.82 |
Sellers (Offers)
| Price($) | Vol. | No. |
|---|---|---|
| $40.87 | 1230 | 2 |
View Market Depth
| No. | Vol. | Price($) |
|---|---|---|
| 1 | 12 | 40.800 |
| 1 | 100 | 40.790 |
| 1 | 4 | 40.760 |
| 2 | 118 | 40.750 |
| 1 | 75 | 40.740 |
| Price($) | Vol. | No. |
|---|---|---|
| 40.870 | 1000 | 1 |
| 40.900 | 15 | 1 |
| 40.920 | 400 | 1 |
| 40.940 | 12 | 1 |
| 40.950 | 1000 | 1 |
| Last trade - 16.10pm 09/08/2024 (20 minute delay) ? |
Featured News
| BHP (ASX) Chart |


