Additionally there are higher odds of El Nino type weather. In a bad El Nino you get a massive rain event from Oct to April or so from memory - which could stuff up next years harvest.
If this occurs this could hinder drying of this coming harvest in August to October as well (relatively), and also hinder the drying of moist soil (if the moisture remains). During the typical Cali Aug to Oct harvest there would be higher odds of rain. Even without rain events there would be more cloud cover, which can also create warmer nights. This creates the risk of there being a higher abundance of yeast and other pathogens (well for Almonds anyway) in the soil microbiome, and of a less than ideal soil microbiome (due to moister and warmer overnight conditions) which can impact the tree productivity in the following year as well due to heaps of spores being around.
My point is I believe we are looking at higher expectations of impacts on two harvests in a row in Cali, and not just one. Of course we are only talking probabilities, and nothing definitive.
Of course we could end up paying up for water here too, but the conditions could be perfect allowing for water availability.
All IMO
https://earthobservatory.nasa.gov/features/ElNino
mce-anchorCloudiness and Precipitation
By changing the distribution of heat and wind across the Pacific, El Niño alters rainfall patterns for months to seasons. As the warm ocean surface warms the atmosphere above it, moisture-rich air rises and develops into rain clouds. So while the majority of precipitation tends to occur over the west Pacific warm pool in neutral years, much more develops over the central and eastern Pacific during an El Niño event.
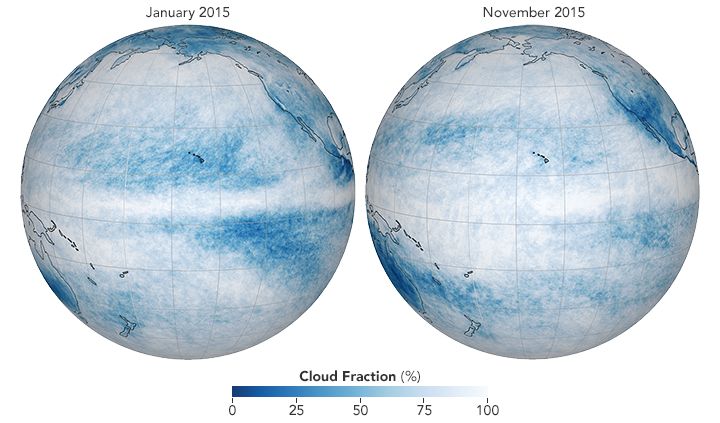
Just as El Niño influences ocean surface temperatures, it also alters the amount and location of clouds over the Pacific. (NASA Earth Observatory maps by Joshua Stevens, using data from the NASA Earth Observations.)
The globes show cloud fraction over the Pacific Ocean in January and November 2015 as measured by the MODIS instrument on NASA's Aqua satellite. The data show how often and how much the sky was filled with clouds over a particular region. Cloudiness is a result of moisture rising from the ocean surface into the atmosphere. During an El Niño (November image), cloud cover increases in the eastern Pacific due to the warm water releasing more moisture and heat into the atmosphere. Those clouds can lead to more rain, but they also shade the water by day and trap heat near the surface at night.
Additionally there are higher odds of El Nino type weather. In a...


Add SHV (ASX) to my watchlist
 (20min delay) (20min delay)
|
|||||
|
Last
$3.36 |
Change
-0.040(1.18%) |
Mkt cap ! $412.8M | |||
| Open | High | Low | Value | Volume |
| $3.44 | $3.44 | $3.35 | $210.2K | 62.01K |
Buyers (Bids)
| No. | Vol. | Price($) |
|---|---|---|
| 15 | 4587 | $3.35 |
Sellers (Offers)
| Price($) | Vol. | No. |
|---|---|---|
| $3.36 | 3290 | 13 |
View Market Depth
| Last trade - 13.32pm 16/05/2024 (20 minute delay) ? |

|
|||||
|
Last
$3.34 |
Change
-0.040 ( 1.82 %) |
||||
| Open | High | Low | Volume | ||
| $3.39 | $3.44 | $3.34 | 17933 | ||
| Last updated 13.55pm 16/05/2024 ? | |||||
| SHV (ASX) Chart |