Hi Peter,
Just responding to your questions regarding the optimism possibly expressed by others on here. I really can only vouch at this stage for myself from a technical analyst's point of view, but with examination of the unfolding technical patterns there's some very positives signs in the road ahead.
Specifically, one thing I'm always looking for are signs of accumulation. Nielsen's supply/demand indicator is arguably one method that has been applied for diagnosing 'smart money' entering a stock, although within a similar vein, I prefer to use Twiggs Money Flow (TMF) indicator. Plus, it's free if you use IC.
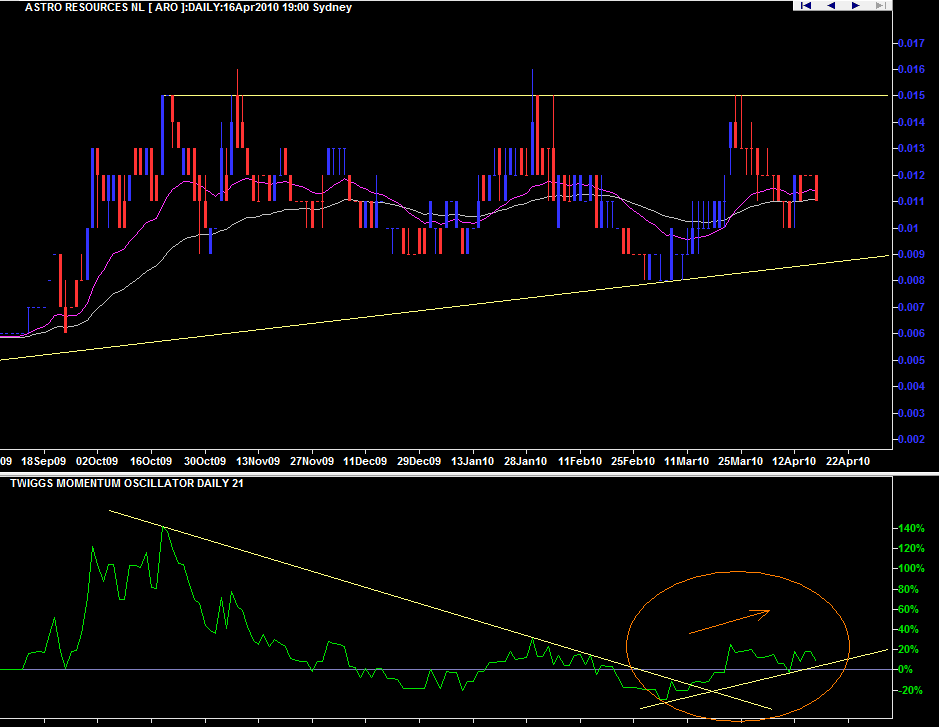
Essentially, a line sloping up indicates accumulation particularly once the 0 line has been crossed. Inspecting the chart below, we can see that distribution (or selling pressure) has been occurring from Oct 09 all the way through to early March 2010. Only recently have we seen this shift towards a positive slope while the share price still appears to be in an apparent channel. If this TMF trend continues we can be increasingly confident that the share price will start to move into more positive territory soon. It's worth noting that the TMF indicator can also be used for examining divergences (but that's a different story).
I should premise here by saying that relying on one indicator alone might be considered naive or foolhardy, hence I try to use a number of other supporting indicators as well. I have discussed these earlier on a different thread. More importantly though I do find just using volume, price and chart patterns alone or combination to be the most effective tools for gauging market direction, followed second by tapping into the clues hidden within moving indicators.
IMO, if the current pattern continues as expected then I think next week things will start to look a bit more interesting!
cheers
S

________________________________________________________________
nb. The above are only my humble opinions and are solely for entertainment purposes!
- Forums
- ASX - By Stock
- calm before the storm
ASE
astute metals nl
Add to My Watchlist
10.0%
 !
2.2¢
Hi Peter, Just responding to your questions regarding the...
Featured News
Add to My Watchlist
What is My Watchlist?
A personalised tool to help users track selected stocks. Delivering real-time notifications on price updates, announcements, and performance stats on each to help make informed investment decisions.
 (20min delay) (20min delay)
|
|||||
|
Last
2.2¢ |
Change
0.002(10.0%) |
Mkt cap ! $13.59M | |||
| Open | High | Low | Value | Volume |
| 2.2¢ | 2.2¢ | 2.2¢ | $2.201K | 100.0K |
Buyers (Bids)
| No. | Vol. | Price($) |
|---|---|---|
| 1 | 8976 | 2.0¢ |
Sellers (Offers)
| Price($) | Vol. | No. |
|---|---|---|
| 2.3¢ | 100000 | 1 |
View Market Depth
| No. | Vol. | Price($) |
|---|---|---|
| 1 | 8976 | 0.020 |
| 1 | 29600 | 0.019 |
| 2 | 425535 | 0.018 |
| 1 | 30000 | 0.017 |
| 1 | 6250 | 0.016 |
| Price($) | Vol. | No. |
|---|---|---|
| 0.023 | 100000 | 1 |
| 0.024 | 30400 | 1 |
| 0.028 | 241670 | 1 |
| 0.030 | 200000 | 1 |
| 0.035 | 198798 | 1 |
| Last trade - 13.40pm 11/07/2025 (20 minute delay) ? |
Featured News
| ASE (ASX) Chart |
The Watchlist
VMM
VIRIDIS MINING AND MINERALS LIMITED
Rafael Moreno, CEO
Rafael Moreno
CEO
SPONSORED BY The Market Online


