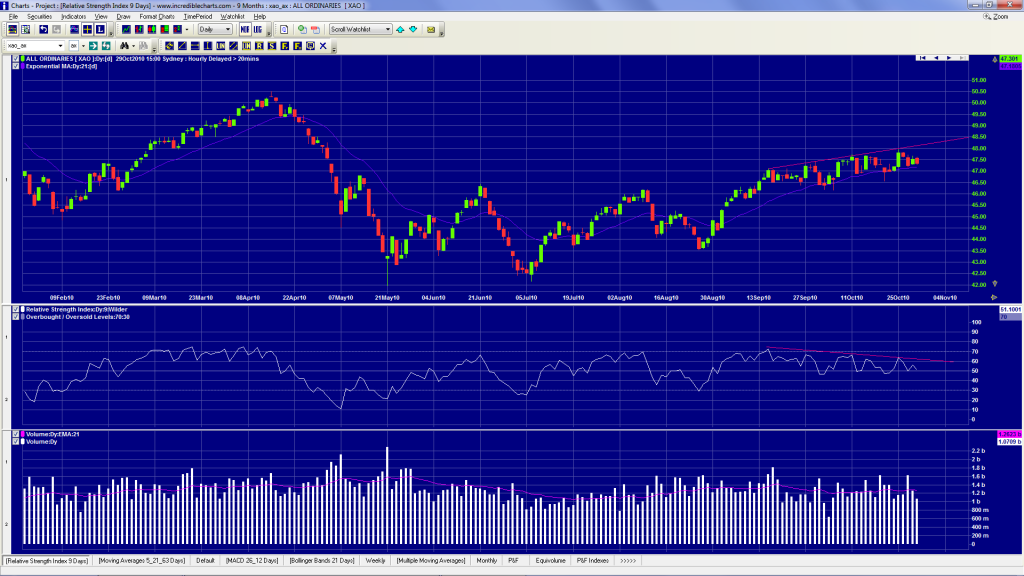
RSI looks bearish.
If the MACD turns negative and we slip under the middle of the bolly bands, then i reckon we'll see a retracement.
Good buying opportunity around the 200 day moving average.
Until we break through 4700 and up to 4750, I can see a bounce coming.As we come into the end of the reporting season, the market might dip before having a xmas rally to punch through.
Of course if all that happens beforehand....well thats great too.
Sorry this is a chart of the XAO but I just realised after uploading it. But you get the picture.
- Forums
- ASX - By Stock
- XJO
- can't believe it's friday!
can't believe it's friday!, page-23
Featured News
Add XJO (ASX) to my watchlist
 (20min delay) (20min delay)
|
|||||
|
Last
8,300.2 |
Change
15.000(0.18%) |
Mkt cap ! n/a | |||
| Open | High | Low |
| 8,285.2 | 8,317.7 | 8,244.3 |
Featured News
| XJO (ASX) Chart |


