Hi gang,
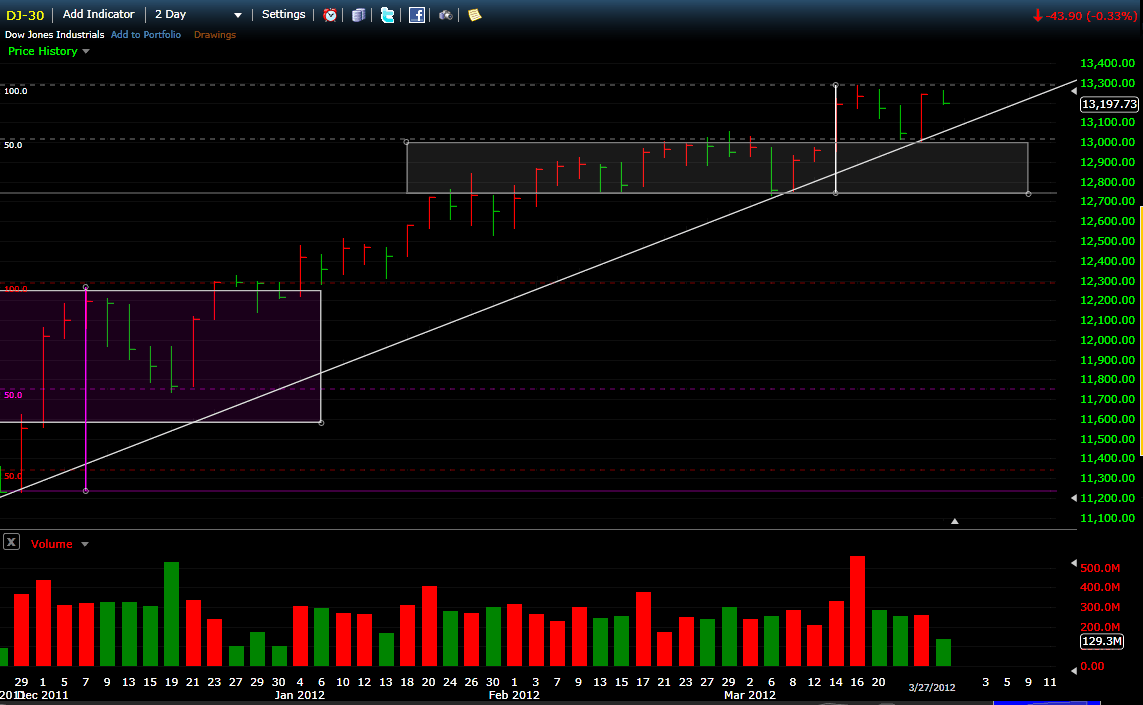
DJIA 2day chart with the last bar half complete
It appears likely a bit of sideways movement is on the cards which is no concern at all.
Could quite easily either pop tonight with a bout of demand arriving or if not just a quiet retreat into the sharping wedge
Also below the chart is a small overnight market wrap
"..U.S. stocks erased a little bit of Monday's sharp run-up in a late-day drop led by declines in energy and financial stocks.
While Monday's action had the look of end-of-quarter/month window dressing, Tuesday looked a little more like investors taking some money
off the table after a strong run in the aforementioned sectors. Health-care and utilities sectors finish higher.
U.S. consumers in March remained confident about the economy and labor markets, according to a report by the Conference Board.
The private research group's index dropped to 70.2 in March from an upwardly revised February reading of 71.6, which was the highest in a year.
This month's figure was close to the 70 anticipated by economists in a Dow Jones Newswires poll.
The "present situation" index, a gauge of consumers' assessment of current economic conditions, rose to 51, the highest score since September 2008.
"This is par for the course for the U.S. It's 'slow and steady wins the race,'" said Diane Jaffee, senior portfolio manager at TCW.
"The U.S. economy, while not as robust as coming out of stronger recessions, is still stronger than people anticipated."
European stock markets ended lower Tuesday as U.S. consumer confidence data disappointed, while French oil group Total SA tumbled
as concerns mounted over a gas leak at a North Sea platform.
"The take-away from this is that consumer spending and 70% of the economy is set to rise and therefore will carry the main U.S. equity indexes higher," he said.
French oil group Total fell 6% amid a gas leak that started Sunday in the Elgin field in the North Sea and was still ongoing."
- Forums
- ASX - By Stock
- XJO
- capital wednesday
capital wednesday, page-5
-
- There are more pages in this discussion • 139 more messages in this thread...
You’re viewing a single post only. To view the entire thread just sign in or Join Now (FREE)
Featured News
Add XJO (ASX) to my watchlist
 (20min delay) (20min delay)
|
|||||
|
Last
8,193.4 |
Change
-62.200(0.75%) |
Mkt cap ! n/a | |||
| Open | High | Low |
| 8,255.6 | 8,255.6 | 8,139.1 |
Featured News
| XJO (ASX) Chart |


