Goodmorning,
- Earlier this month Commonwealth Bank (CBA) announced its Q1 2025 profit which was flat year-on-year.
- The bank flagged the continued impact of cost-of-living on economic growth as a pressure and while the results met market expectations, on the day of the announcement its share price slid.
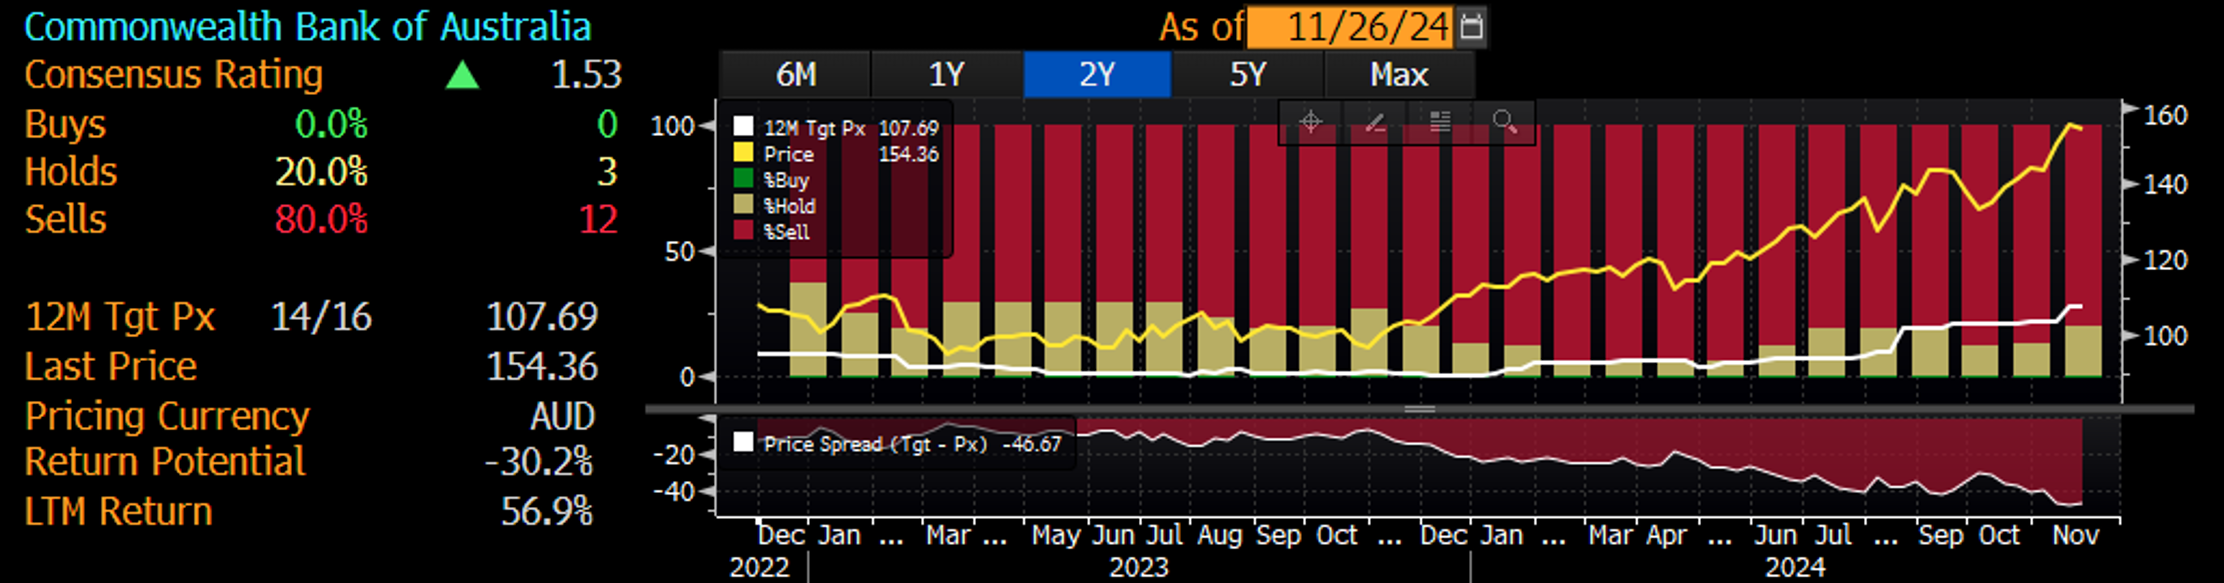
- CBA’s results and outlook did not inspire any sell-side analysts to change their recommendations, with most still having CBA as a sell.
- Since then, CBA rallied to hit $160 on the 25th November, over 50% higher than the year before. It is the most expensive bank in the world, as it has been for some time, and now represents almost 10% of the S&P/ASX 200.
- A review of the analysts’ reports highlights the reasons cited for CBA sell recommendations include:
- The results indicated stubborn cost headwinds, with persistent and upward pressure on investment spend;
- competitive pressures especially in mortgages;
- slowing or stalled credit growth; and
- sky-high valuations.
- We have been highlighting the price of CBA and Australia’s banks and the concentration risk they may have become for some time for many Australian equity portfolios.
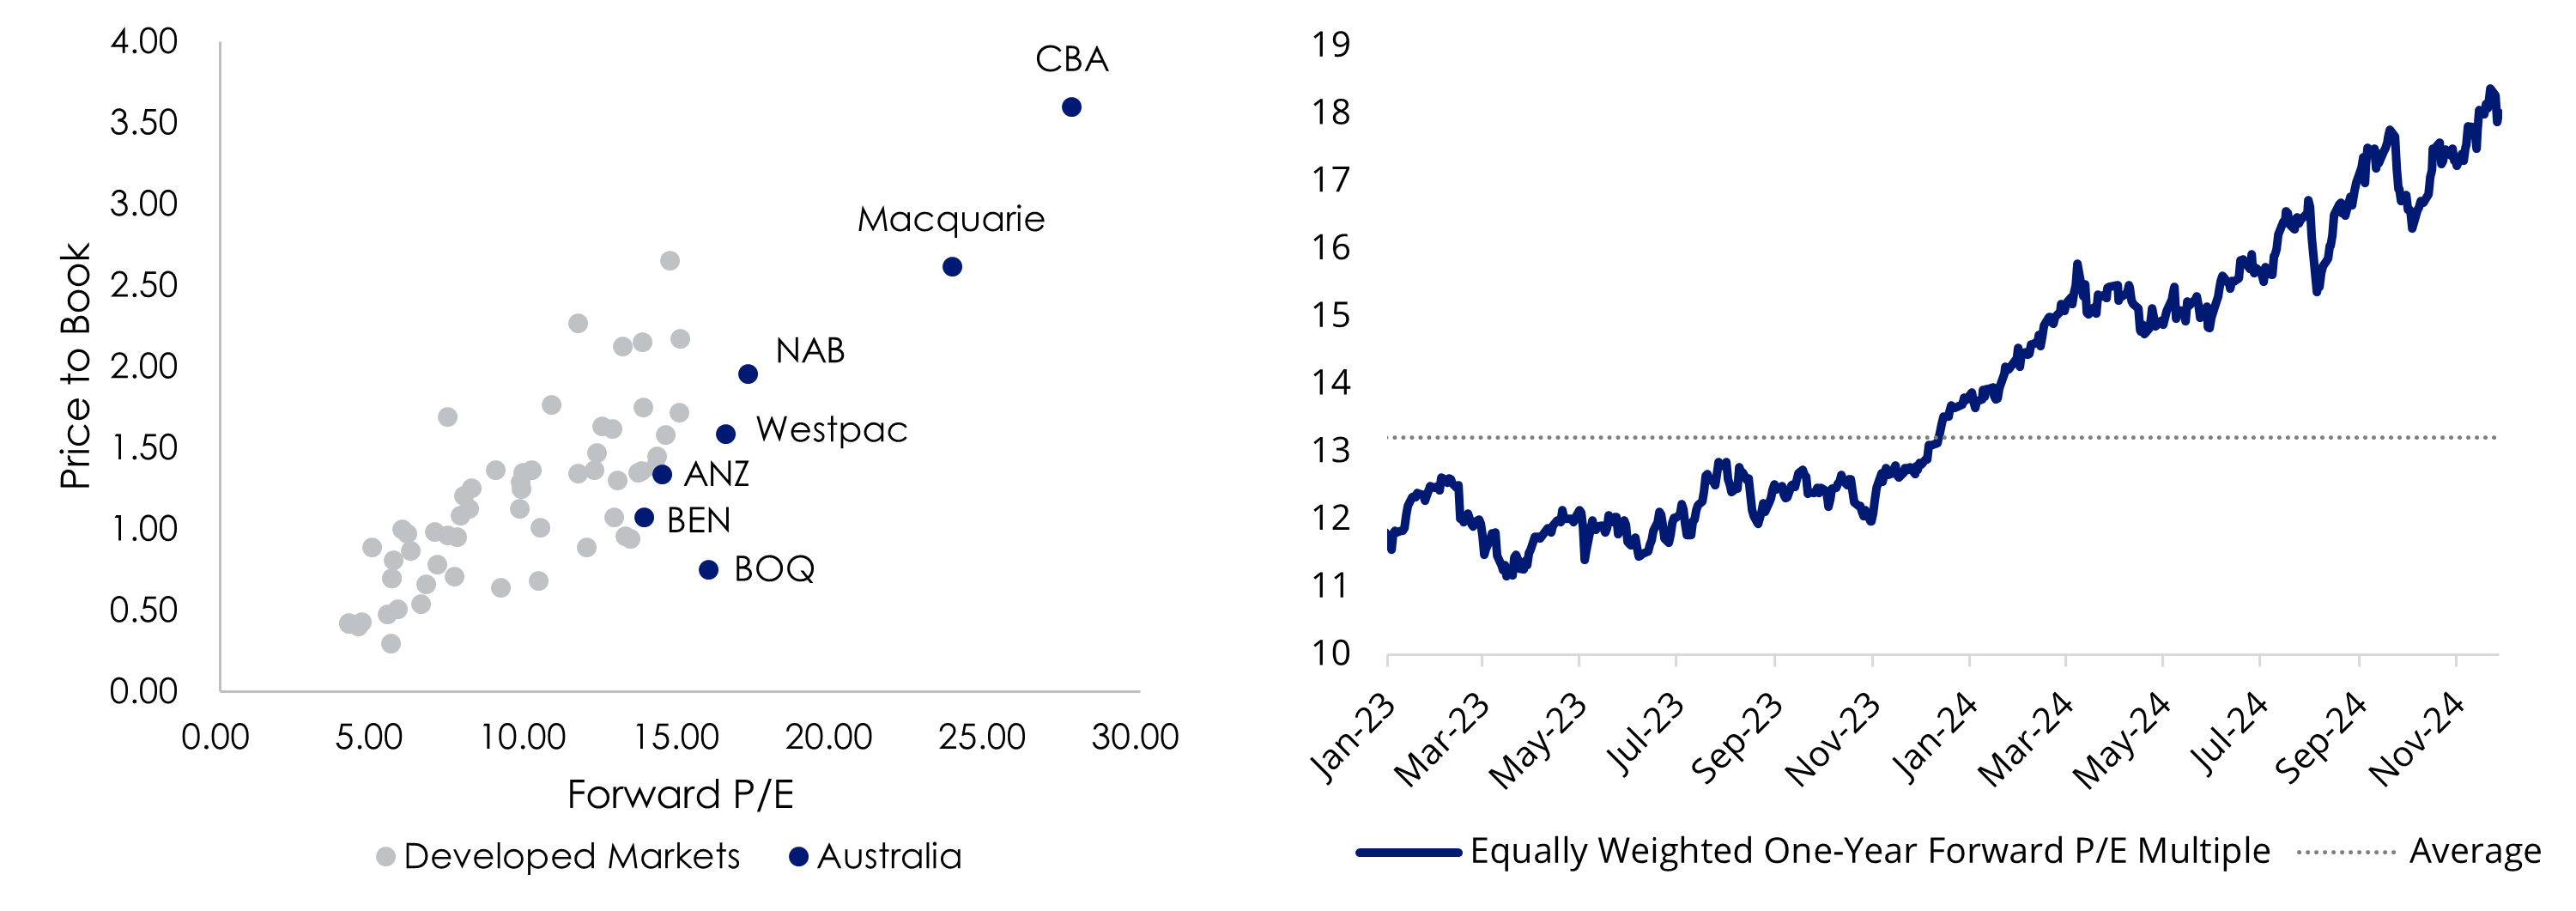
- Australian banks, on a global basis are the most expensive in the developed world on a 12-month forward price-to-earnings and price-to-book basis.
- Should valuations move to be in line with global valuations and thus better reflect the economic outlook, it could disproportionately impact many Australian portfolios, especially those that track or are benchmarked to the S&P/ASX 200 which we have noted before is concentrated to banks which make up over 20% of the Australian benchmark index.
- Such sector bias makes sense if you are bullish on the sector but given the well-noted pressures on banks remain, with margins under pressure, an economic outlook not conducive to growth and defaults potentially rising given that rates are now not expected to fall until well into 2025, a less concentrated approach to Australian equities may be prudent.
- The VanEck Australian Equal Weight ETF (MVW) is a portfolio construction solution that reduces concentration risk to banks and can be deployed to de-risk and diversify with no one security or sector dominating providing a more balanced exposure to Australia’s economy.
- The Australian research community has reinforced their conviction in MVW’s strategy with favourable ratings, including:
- Lonsec – Highly Recommended
- Zenith – Recommended
- For a customised portfolio solution incorporating MVW to improve Australian equity exposures please email or call me, I am happy to show how MVW could be included as a low-cost core portfolio to replace/complement an active manager and/or S&P/ASX index tracker.
- For large trade orders please contact our Capital Markets desk on +61 2 8038 3317.
Australian bankvaluations stretched
The shareprice march of CBA so far in 2024 has been impressive. Its price rise hasconfounded many sell-side analysts and fund managers, who have been warning theshares are overvalued, with many recommending a “sell”. Some have mistakenlyblamed CBA’s price rise on the waves of passive investment (weprove that wrong here), the Australian Financial Review also posited the realreason why CBA shares keep rising is steady buying from a loyal band ofretail investors (which we think is more believable) and the (tax) cost ofdivesting.
Manysell-side analysts still have CBA as a ‘sell’ recommendation.
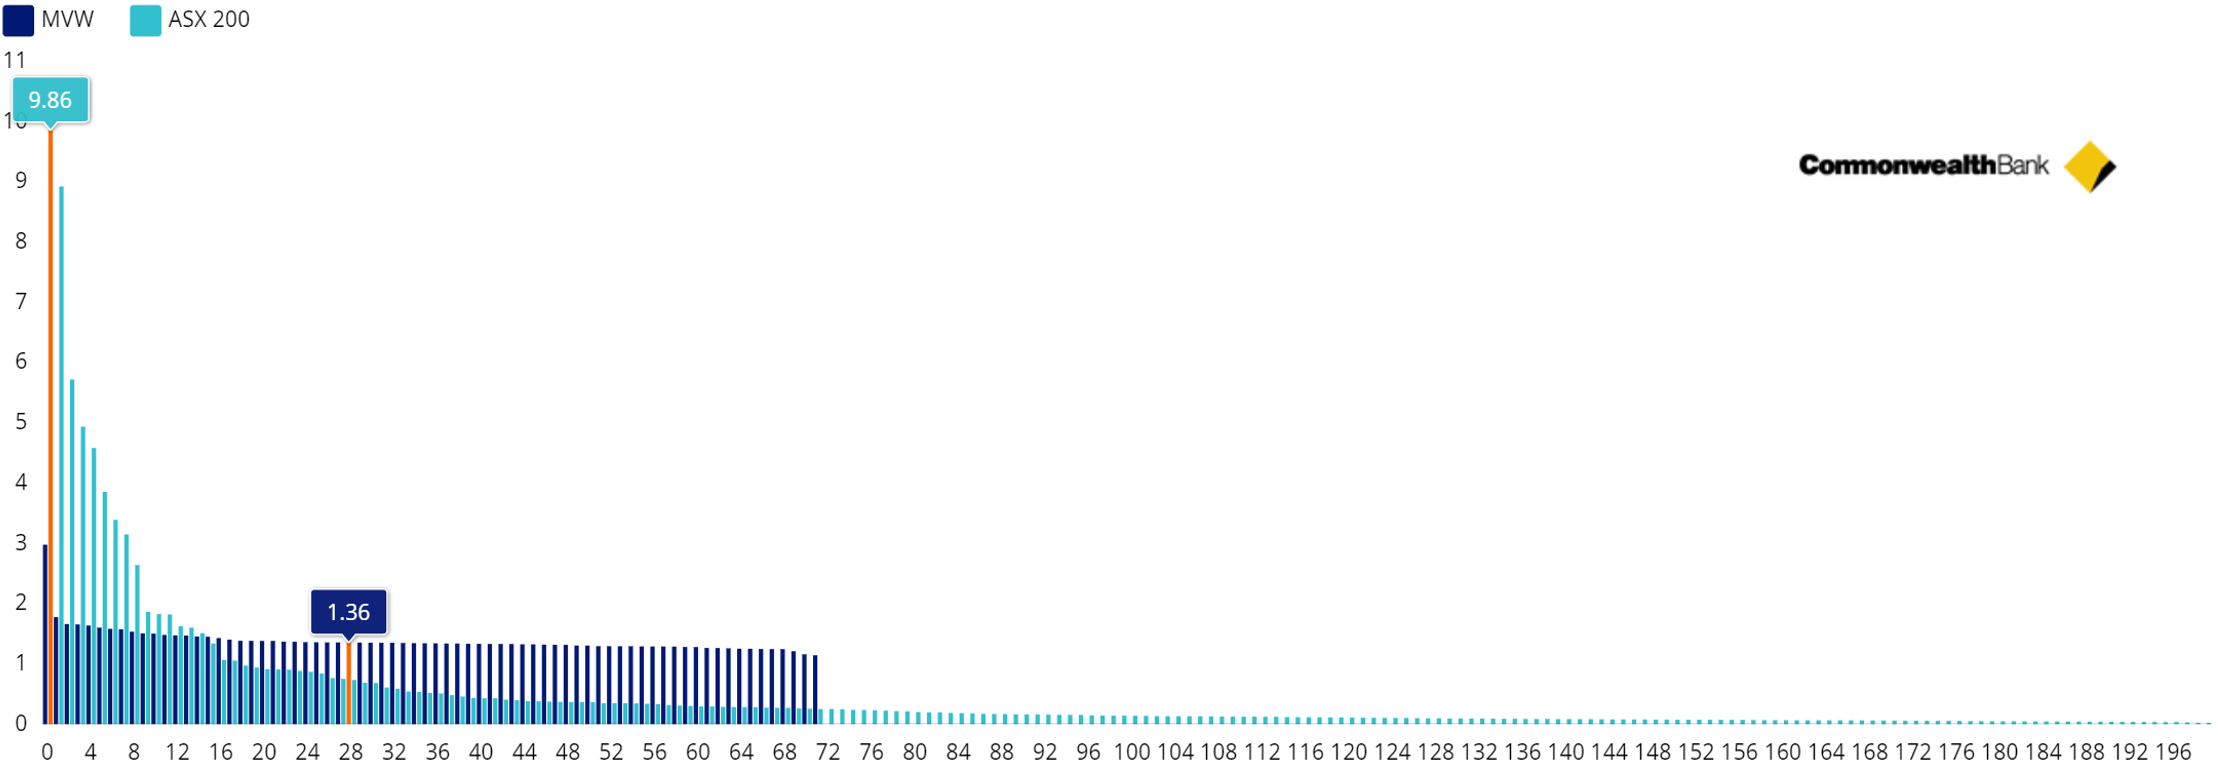
Chart 1: CBA sell-side price recommendations
Source:Bloomberg, as at 26 November 2024. Not a recommendation to act.
This is notonly a CBA story. Australia’s banks have all had a strong year, in terms ofshare price returns, and there is no doubt that Australia’s biggest banksvaluations are stretched and are among the highest globally.
Chart 2 and Chart 3: Global bank valuation; Average big 4, priceto earnings
Charts 2 and3 source: Bloomberg, VanEck 26 November 2024.
But it’s notjust the sky-high valuations that are causing alarm for analysts. Banks alsoface headwinds. A review of the analysts' reports cites cost headwinds, withpersistent and upward pressure on investment spending, increased competitionand slowing or stalled credit growth.
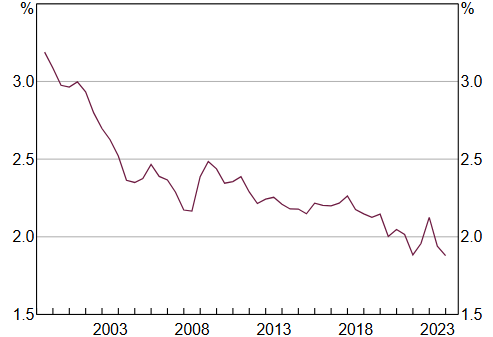
It is worthnoting that, despite rates being as high as they were in 2010 (and beingexpected to stay at that level through to at least the second half of 2025) thebanks’ net interest margins have not increased to the level they were in 2010,as investors may have expected with a return to higher rates. Major banks’ NIMsare more than 20% lower than in 2010, dropping below 2%, as competitivepressures squeeze margins.
Chart 4: Major Banks’ Net Interest Margin* (Domestic,half-yearly)
Released on 6November 2024 (data updated to 31 October 2024)
* Data for a given period relate to banks’ public profit reports released inthat half; IFRS basis from 2006, AGAAP prior, excludes St George Bank andBankwest prior to the first half of 2009.
Sources: Banks’s financial reports; RBAThis impactsthe banks’ earnings. A review of recent estimated earnings per share (EPS)growth highlights that there are no expected material earnings upgrades for thebig four banks. With share prices already at a premium, estimated EPS growthwill further pressure the banks’ share prices.
Table 1: Big 4 Bank - EPS Growth YoY%
FY 2022
FY 2023
FY 2024
1 CBA
15.5
8.4
-4.5
2 ANZ
14.7
5.7
-9.2
3 NAB
10.2
9.4
-1.9
4 WBC
1.2
31.9
-0.2
Source:FactSet, 25 November 2024. Not a recommendation.
Anotherheadwind that Australia’s banks must navigate is the economic outlook. Slowingcredit growth and the expectations that rates will be higher for longerincreasing the potential for arrears will also put pressure on lenders.
The problemfor most Australian investors is that Australian portfolios, especially thosethat track or are benchmarked to the S&P/ASX 200 have a significantexposure to banks because they make up over 20% of the Australian benchmarkindex.
A solution formanaging mega-cap exposure with alternative weighting
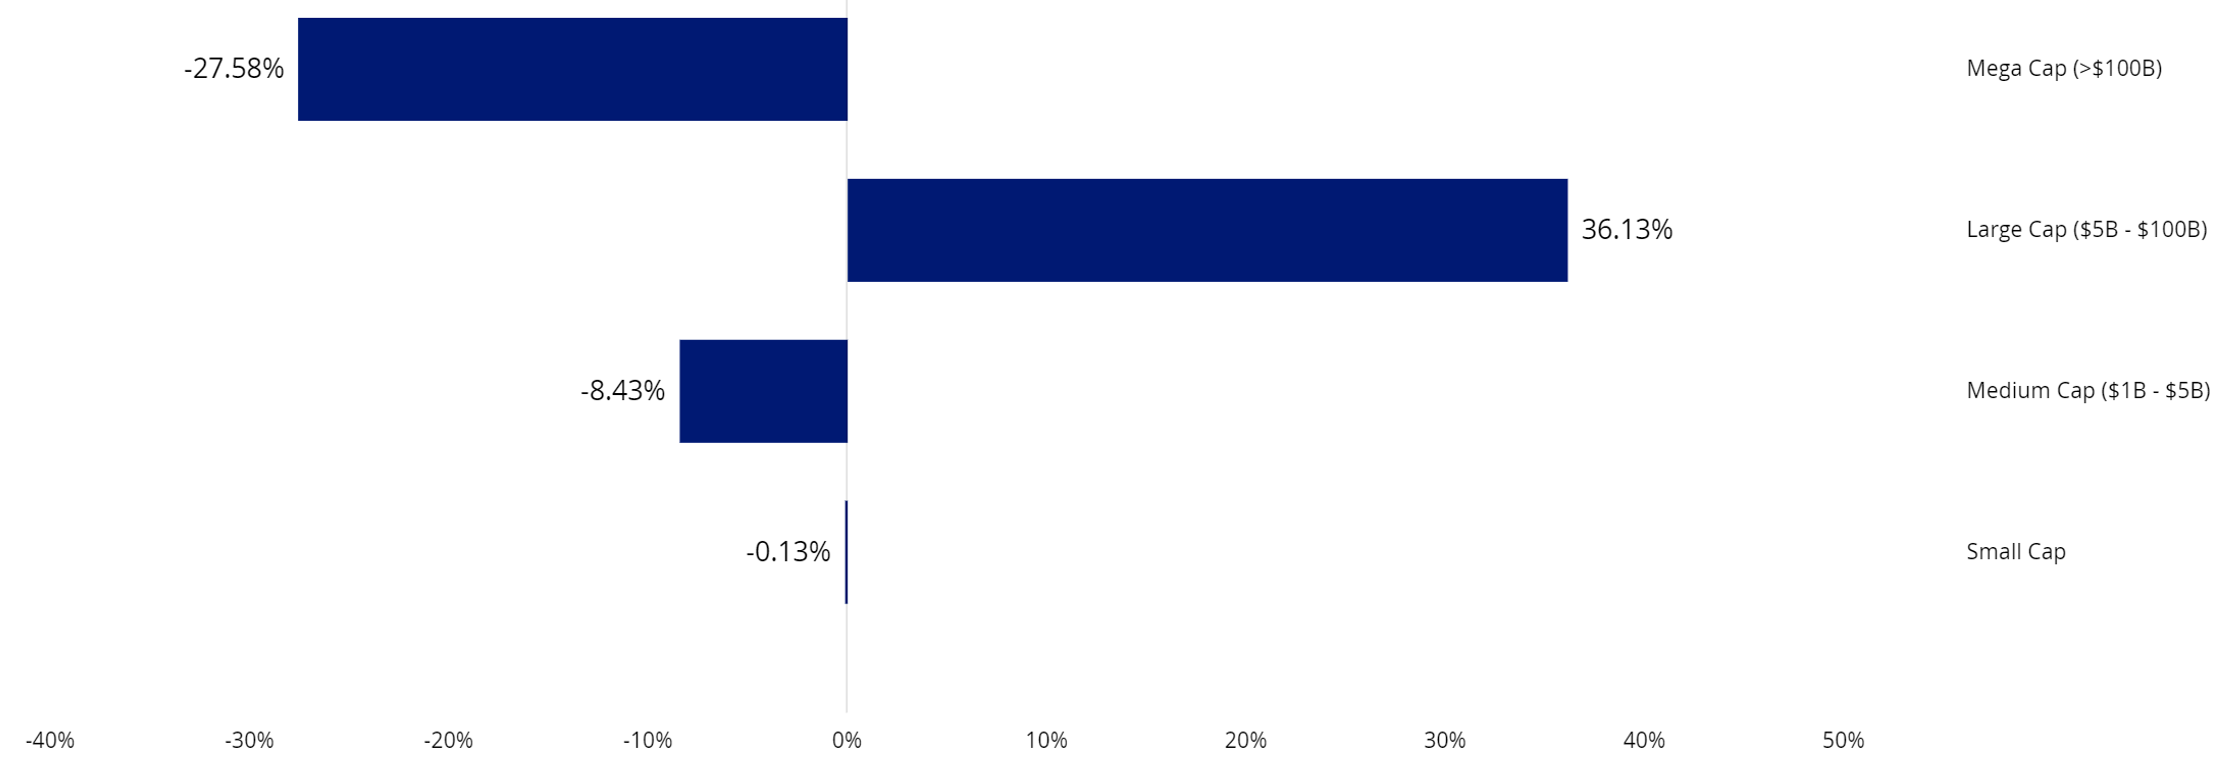
VanEck’sAustralian Equal Weight ETF (MVW)equally weights the largest and most liquid stocks on the ASX at eachrebalance. Because of this, at the last rebalance, no company was more than1.39%. MVWhas less exposure to the mega-caps that dominate the S&P/ASX 200 Indexcompared to many Australian equity portfolios. MVW is underweight mega capcompanies and overweight those large companies outside the mega-caps.
Chart 5: Market Cap Weight Differential: MVW vs S&P/ASX 200
Source:VanEck, FactSet; as at 31 October 2024.
Calculatedby subtracting S&P/ASX 200 market cap bin weights from respective MVWmarket cap bin weights; positive differentials indicate greater MVW weight inthe bin
You can seebelow, relative to the S&P/ASX 200, MVWhas a higher weighting to stocks outside the top 15. As at the end of October2024, the big 4 represented 23.24% of the S&P/ASX 200 but were only 5.41%of MVW.
Chart 6: S&P/ASX 200 and MVW company weightings (%)
Source:FactSet, 31 October 2024
Manyadvisers and their investors are already using MVWas their core Australian equity allocation, around which they can addhigh-conviction satellite ideas.
MVW’s resurgentNovember
We have seenthe dynamics noted above playing out in MVW’s recent performance. During therecent bout of market volatility, MVWhas outperformed the S&P/ASX 200 by 0.99% over the past three months,noting of course that past performance cannot be relied upon for futureperformance.
Table 2: Trailing performance to 28 November 2024
MTD (%)
1 mth (%)
3 mths (%)
YTD
(%)
1 yr
(%)
3 yrs
(% p.a.)
5 yrs
(% p.a.)
10 yrs
(% p.a.)Since inception (% p.a.)
1 VanEck Australian Equal Weight ETF (MVW)
3.99
3.24
6.86
13.41
22.49
8.83
7.58
10.00
9.69
2 S&P/ASX 200 Accumulation Index
3.88
3.10
5.87
15.17
24.83
9.46
8.23
9.09
8.59
3 Difference
+0.11
+0.14
+0.99
-1.76
-2.34
-0.63
-0.65
+0.91
+1.10
* MVWInception date is 4 March 2014 a copy of the factsheetis here.
Table 2source: Morningstar Direct, VanEck. The table above shows past performance ofMVW and of the S&P/ASX 200. You cannot invest directly in an index. Resultsare calculated to the last business day of the month and assume immediatereinvestment of distributions. MVWresults are net of management fees and other costs incurred in the fund, butbefore brokerage fees and bid/ask spreads incurred when investors buy/sell onthe ASX. Returns for periods longer than one year are annualised. Past performance is not a reliable indicator of future performance. The S&P/ASX 200 Index is shown for comparison purposes as it is the widely recognised benchmark used to measure the performance of the broad Australian equities market. It includes the 200 largest ASX-listed companies, weighted by market capitalisation. MVW’s index measures the performance of the largest and most liquid ASX-listed companies, weighted equally at rebalance. MVW’s index has fewer companies and different industry allocations than the S&P/ASX 200. Clickhere for more details.
In additionto MVW,another way to take advantage of the current market dynamics is our recentlylaunched VanEck Geared Australian Equal Weight Fund (Hedge Fund) (GMVW).
Keypoints
Some of thereasons advisers have been employing MVWfor their clients’ portfolios are:
- Diversification – close to 2 ½ times more diversified than the S&P/ASX 200, as measured by the Herfindahl Index*.
- Style – equal weighting is compelling in Australia and blends well with other high conviction stock/manager satellite positions, without creating too much overlap.
- Consistency – this is a rules based strategy, no manager views, no single stock bets.
- Cost effective – 0.35% p.a. managementfee which is much lower than active Australian equities managers (almost 1/3 the average), allowing investors to reduce total portfolio costs.
- Research support – MVW has been awarded ratings of:
- Highly Recommended by Lonsec
- Recommended by Zenith
To receive acopy of research reports or for more information on MVW please contact me orvisit our website here.
Keyrisks
Aninvestment in the ETF carries risks. These include risks associated withfinancial markets generally, individual company management, industry sectors,fund operations and tracking an index. GMVW borrows money to increase theamount it can invest. While this can result in larger gains in a rising market,it can also magnify losses in a falling market. The greater the level ofgearing in the Fund, the greater the potential loss of capital. The Fund isconsidered to have a higher investment risk than a comparable fund that isungeared. See the PDS for details.
Many thanks,
from Van Eyk
Goodmorning,Earlier this month Commonwealth Bank (CBA) announced...


Add to My Watchlist
What is My Watchlist?
 (20min delay) (20min delay)
|
|||||
|
Last
$168.33 |
Change
-0.570(0.34%) |
Mkt cap ! $281.6B | |||
| Open | High | Low | Value | Volume |
| $169.10 | $169.13 | $167.78 | $231.7M | 1.376M |
Buyers (Bids)
| No. | Vol. | Price($) |
|---|---|---|
| 1 | 3 | $168.28 |
Sellers (Offers)
| Price($) | Vol. | No. |
|---|---|---|
| $168.33 | 889 | 1 |
View Market Depth
| Last trade - 16.19pm 16/09/2025 (20 minute delay) ? |
| CBA (ASX) Chart |