G'day All,
Just posted this on weekend charting, these are my thoughts.
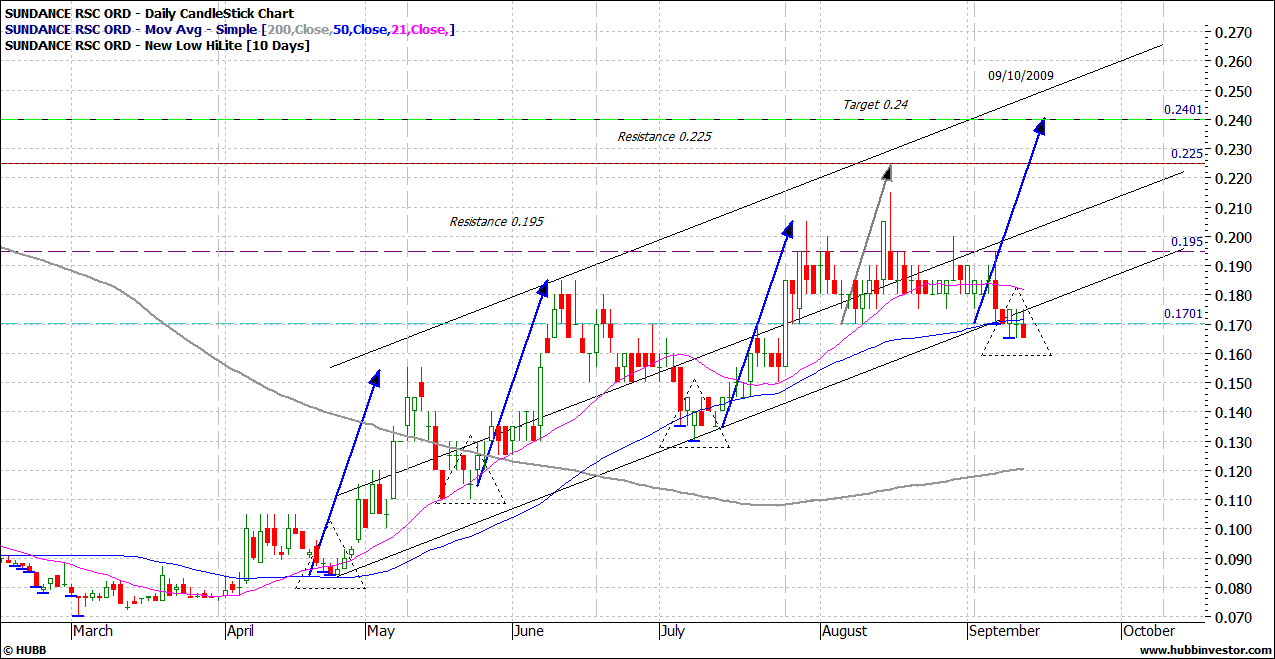
This looks like a classic bear trap to me, with all indicators in the same zone where the other moves began.
The stock is oversold on the Stochastic and it's currently around the 15 area and could cross and turn up early this week. The MACD is also in the same area where the move in mid July started.
Note: The triangles I have drawn in, each 0.7c speed angle has come from a drop of support. Watch closely for volume to come in this week signaling a move to the target of 0.24c (around 1st week in Oct)....:)
Add to My Watchlist
What is My Watchlist?


