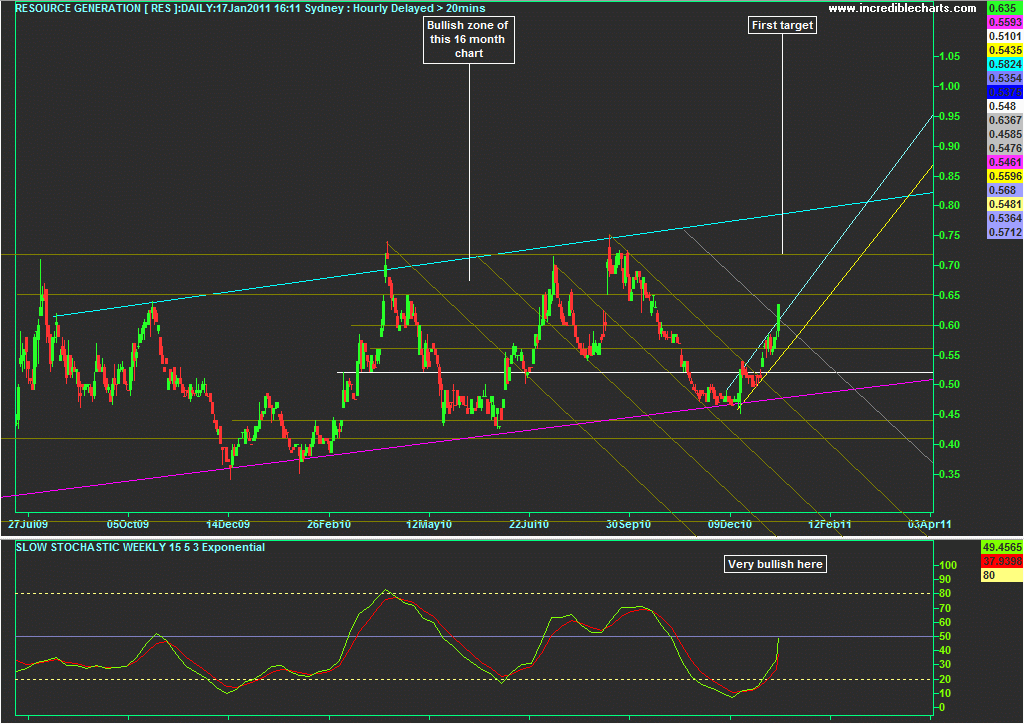
rob, .60c was actually a fairly strong resistance point imo but the sp ploughed through it with ease & on good volume. Interesting the volume has been solid for a good couple of weeks now. Very good sign for the sp I think.
It's hard not to be bullish about today's action/candle as it looks keen to go higher, keep in mind that there is resistance at 65c however on the past 3 ocassions the sp has successfully made it up to at least .71c/.72c so I guess thats where it's heading st imo, it may even give the blue line a nudge before a bit of consolidation?
Look at the WEEKLY stochastic (on daily chart below), price on the mid point and heading north with lots of room, v bullish considering where the sp is on the daily.

- Forums
- ASX - Short Term Trading
- RES
- chart analysis???
chart analysis???, page-22
-
- There are more pages in this discussion • 41 more messages in this thread...
You’re viewing a single post only. To view the entire thread just sign in or Join Now (FREE)
Featured News
Add RES (ASX) to my watchlist
Currently unlisted public company.
The Watchlist
EQN
EQUINOX RESOURCES LIMITED.
Zac Komur, MD & CEO
Zac Komur
MD & CEO
SPONSORED BY The Market Online


