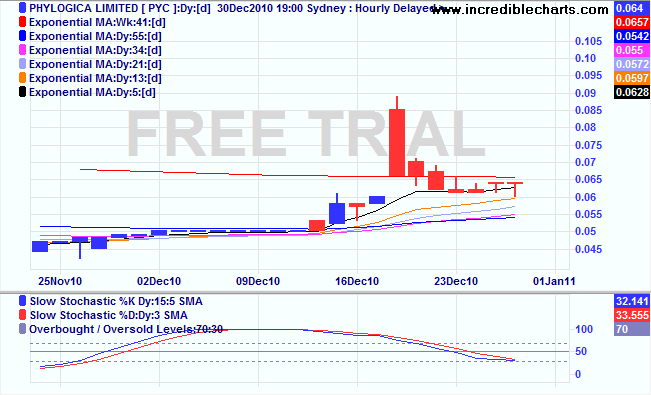
""Doji patterns shouldn't be used in isolation. Instead they should be compared to recent price movements. The importance of the signals sent by the doji is minimized if a series of small candles has been observed. On the other hand, the importance of the doji is stressed if it is preceded by a long white candle if the market is going up or a long black candle if the market is going down."
"Double Doji
Double doji [in PYC's case double dragonfly doji] refers to the equilibrium state in which buyers and sellers are. Thus, typically it can be interpreted as a sure signal that a trend reversal will occur."
... double doji coupled with todays positive slow stoch positive cross suggests break up???

- Forums
- ASX - By Stock
- PYC
- chart - break up?
PYC
pyc therapeutics limited
Add to My Watchlist
2.21%
 !
$1.33
chart - break up?
Featured News
Add to My Watchlist
What is My Watchlist?
A personalised tool to help users track selected stocks. Delivering real-time notifications on price updates, announcements, and performance stats on each to help make informed investment decisions.
 (20min delay) (20min delay)
|
|||||
|
Last
$1.33 |
Change
-0.030(2.21%) |
Mkt cap ! $775.7M | |||
| Open | High | Low | Value | Volume |
| $1.35 | $1.35 | $1.29 | $446.7K | 343.1K |
Buyers (Bids)
| No. | Vol. | Price($) |
|---|---|---|
| 2 | 880 | $1.33 |
Sellers (Offers)
| Price($) | Vol. | No. |
|---|---|---|
| $1.36 | 5545 | 2 |
View Market Depth
| No. | Vol. | Price($) |
|---|---|---|
| 2 | 880 | 1.330 |
| 3 | 14138 | 1.320 |
| 1 | 9672 | 1.315 |
| 1 | 945 | 1.310 |
| 4 | 45455 | 1.300 |
| Price($) | Vol. | No. |
|---|---|---|
| 1.355 | 5545 | 2 |
| 1.365 | 945 | 1 |
| 1.370 | 892 | 2 |
| 1.385 | 724 | 1 |
| 1.390 | 12000 | 1 |
| Last trade - 11.45am 17/07/2025 (20 minute delay) ? |
Featured News
| PYC (ASX) Chart |
The Watchlist
LU7
LITHIUM UNIVERSE LIMITED
Iggy Tan, Executive Chairman
Iggy Tan
Executive Chairman
Previous Video
Next Video
SPONSORED BY The Market Online


