Bugger I just lost my reply....grrr
take two
Not an easy chart imo
as you said yourself there is still a small gap
and as old support levels become resistance (white arrows)
I dont think its clear of the 25 ish resistance levels just yet. Above the neckline is the breakout point to add to your position...
This also supports the prevailing trading pattern is an inverted Head and shoulders and a Right hand shoulder needs more accumulation.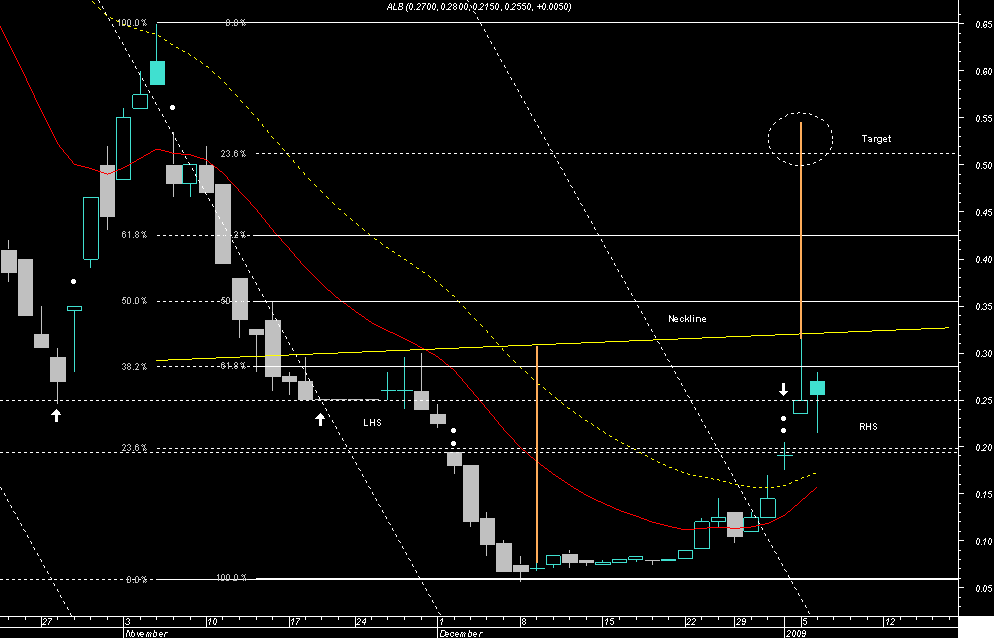
chart for kevi


Add ALB (ASX) to my watchlist
 (20min delay) (20min delay)
|
|||||
|
Last
4.5¢ |
Change
0.000(0.00%) |
Mkt cap ! $2.937M | |||
| Open | High | Low | Value | Volume |
| 0.0¢ | 0.0¢ | 0.0¢ | $0 | 0 |
Buyers (Bids)
| No. | Vol. | Price($) |
|---|---|---|
| 1 | 45555 | 4.5¢ |
Sellers (Offers)
| Price($) | Vol. | No. |
|---|---|---|
| 5.5¢ | 38600 | 1 |
View Market Depth
| Last trade - 16.12pm 30/08/2024 (20 minute delay) ? |
| ALB (ASX) Chart |
Day chart unavailable