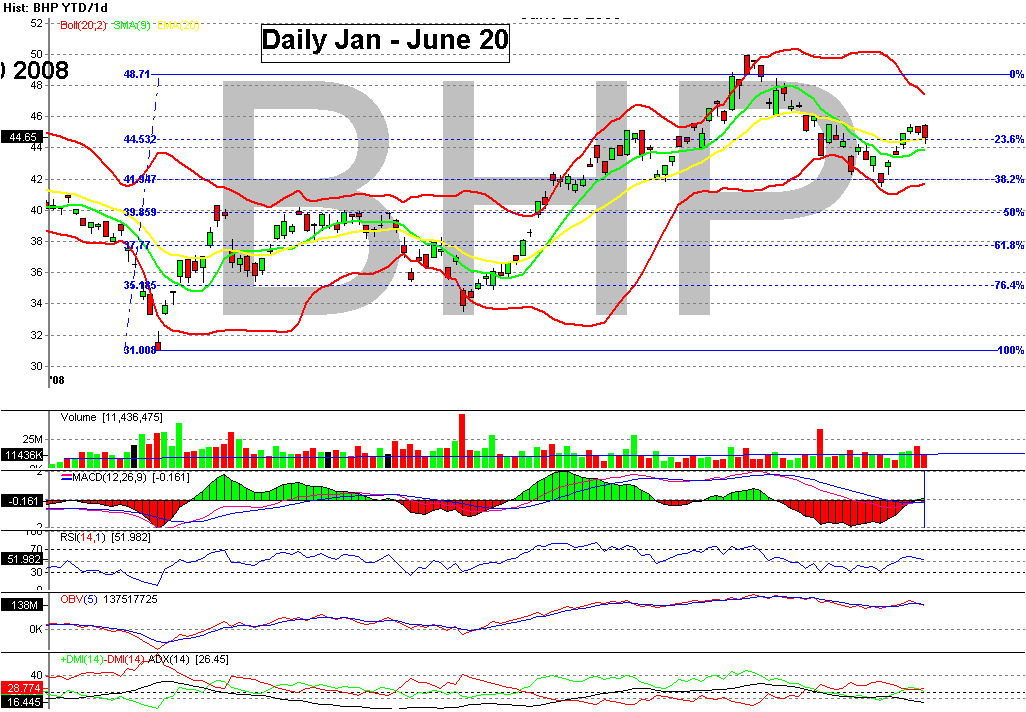
A chart showing where we are might be appropriate as we approach the end of financial year week:
This is a daily chart from January 2, 2008 till Friday June 20, 2008
INDICATORS:-
VOLUME- average. Suggests a lot of fence sitters abound
RELATIVE STRENGTH INDEX (RSI) Average at 51.9. Above 70 is overbought, under 30 oversold.
ON BALANCE VOLUME (OBV)small cossover to a downtrend, indicates volumes might be getting thinner and a downward reversal possible.
DIRECTIONAL MOVEMENT INDEX (DMI) Slight cross over pointing to weakening of price trend. Below 20 weak is a weak trend; above 40 is strong trend. Currently at 16.4
MACD: Apply a magnifying glass to see the trendline cross up thru the signal line. Still ever so slightly in the minus histogram at -0.16. Not decisive enough.
MOVING AVERAGES: Finished dead on the yellow line 20-day, but above green 9-day. Improving.
FIBONACCI: Drawn from January 21 low to May high. SP has retraced to 23% level which is OK, but is also a possible right shoulder for a bearish downtrend.
If the price moves up, then $47, $50 are the obvious targets.
If it drops and fails the 50% retracement around $40, next levels would be $38, and right back to $31 if the economy is in tatters, forming a double bottom ripe for reversal.
chart for monday


Add BHP (ASX) to my watchlist
 (20min delay) (20min delay)
|
|||||
|
Last
$42.68 |
Change
-0.470(1.09%) |
Mkt cap ! $216.4B | |||
| Open | High | Low | Value | Volume |
| $42.71 | $43.20 | $42.68 | $463.8M | 10.82M |
Buyers (Bids)
| No. | Vol. | Price($) |
|---|---|---|
| 1 | 13572 | $42.68 |
Sellers (Offers)
| Price($) | Vol. | No. |
|---|---|---|
| $42.70 | 457 | 1 |
View Market Depth
| Last trade - 16.10pm 28/06/2024 (20 minute delay) ? |
| BHP (ASX) Chart |