Oh OK thanks
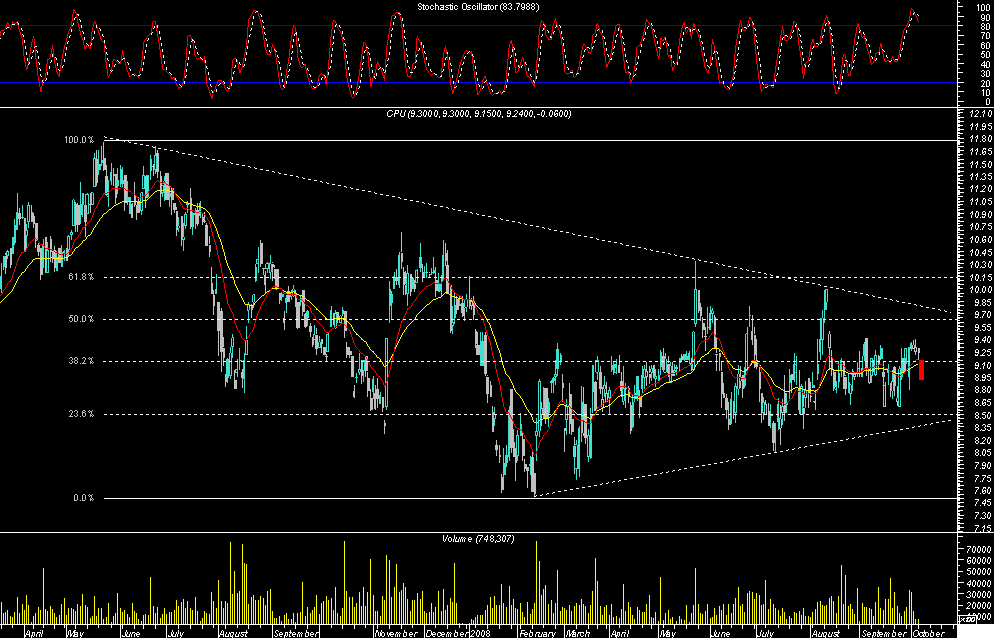
I think these are the fibs you suggested...
You may have more faith in the Fibonacci sequences than I do but todays action recovering from the gap down and reaching the 38.2% Fibline does show a lot of traders use Fibs
Heres the overbought stochastics from last night but combined with a recent drop off in volumes indicates the 900 to 910 region should be an accumulation level for a while and today may close on some sort of doji star candlestick pattern, which means its at an equal bull/bear balance or procrastination point..
doing nicely retracing the opening gap atm
yesterdays low was 915 its 913 atm..
and the 38.2 fib is 912 (approx)
john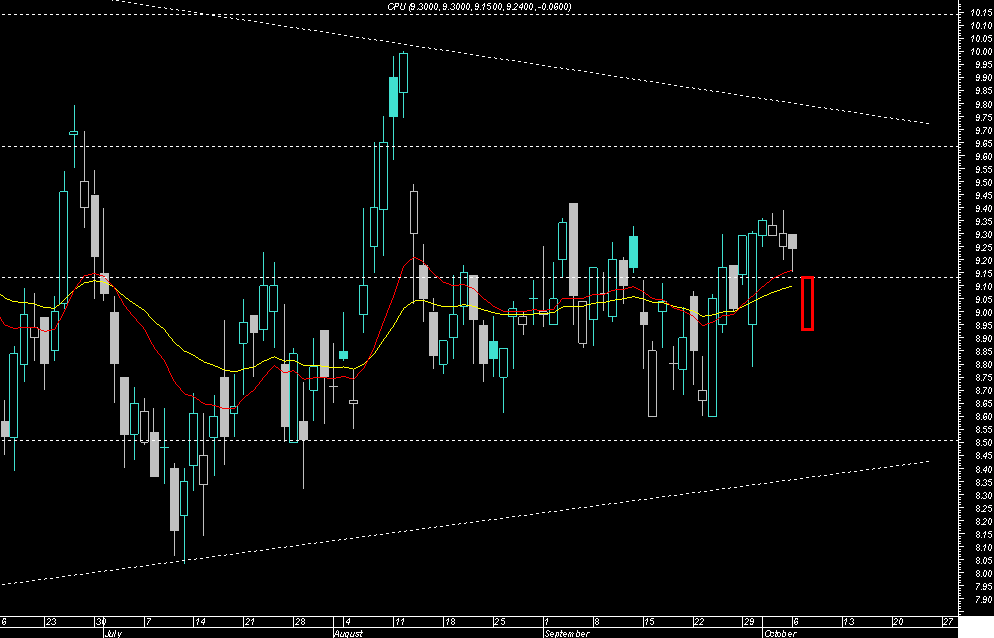
Oh OK thanksI think these are the fibs you suggested...You may...


Add to My Watchlist
What is My Watchlist?
 (20min delay) (20min delay)
|
|||||
|
Last
$36.90 |
Change
-0.220(0.59%) |
Mkt cap ! $21.34B | |||
| Open | High | Low | Value | Volume |
| $36.65 | $36.93 | $36.33 | $55.01M | 1.494M |
Buyers (Bids)
| No. | Vol. | Price($) |
|---|---|---|
| 1 | 149 | $36.87 |
Sellers (Offers)
| Price($) | Vol. | No. |
|---|---|---|
| $36.93 | 65 | 1 |
View Market Depth
| Last trade - 16.10pm 11/09/2025 (20 minute delay) ? |
| CPU (ASX) Chart |