Hey Westie,
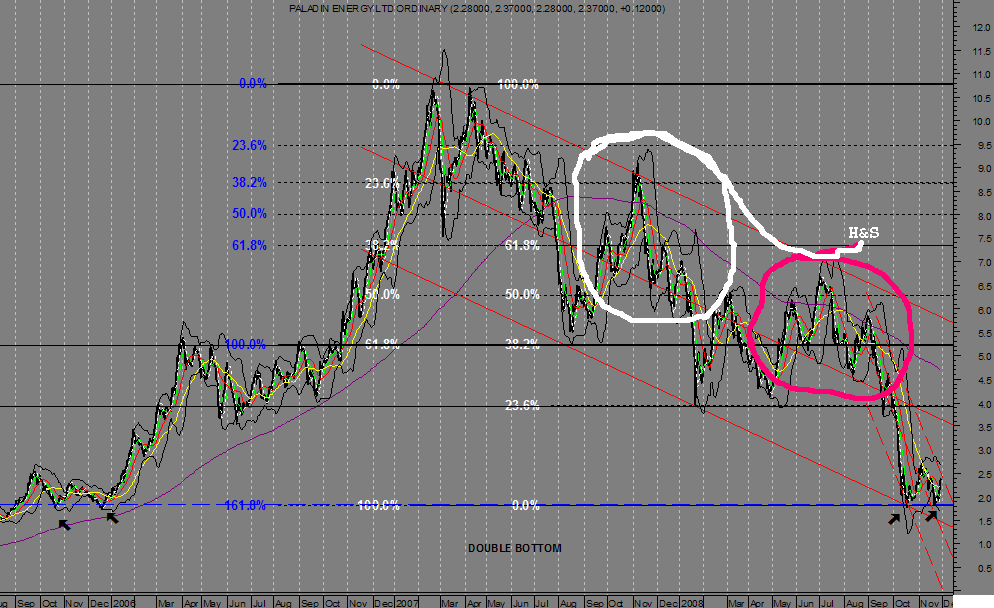
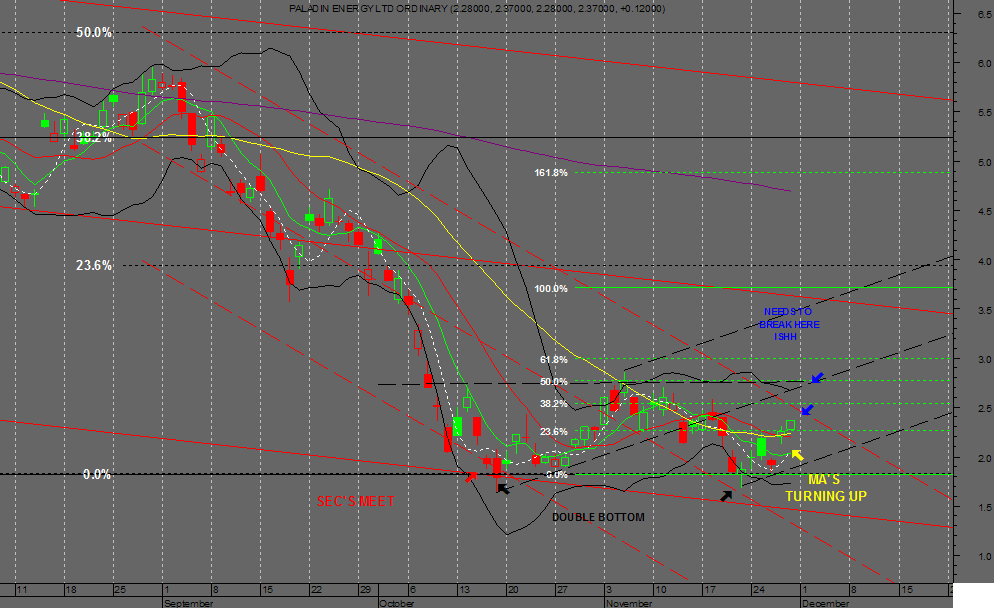
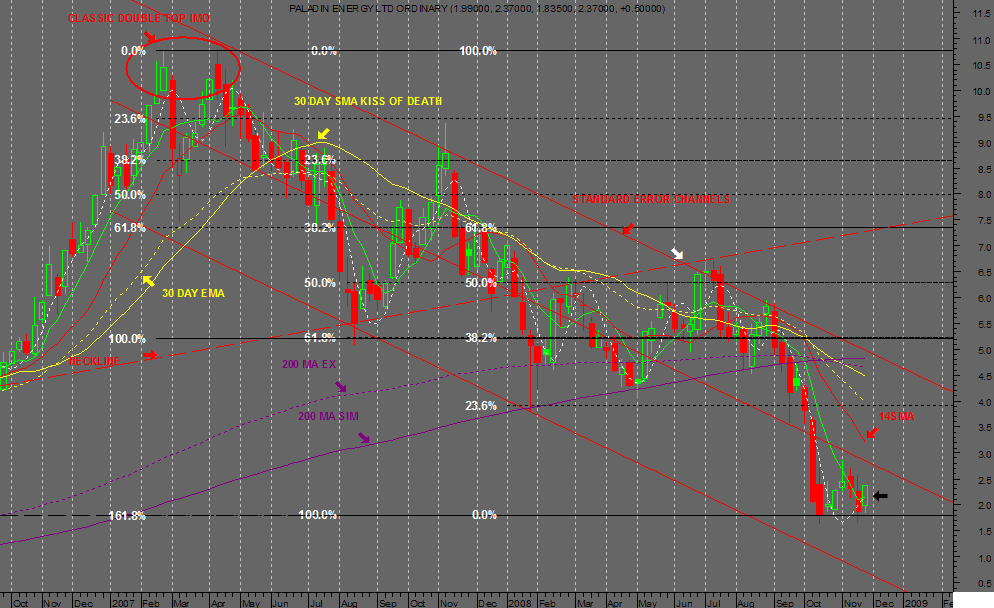
Here's a couple of over all charts with close ups so we don't get confused with which double bottom or what fibs we are talking about.
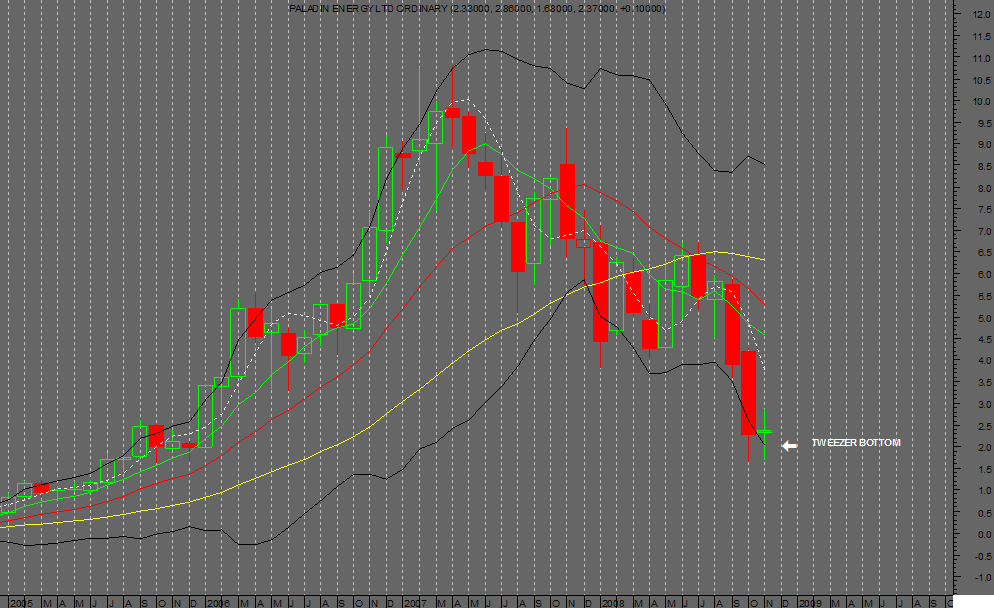
I have taken the the fibs from here as I said they seem to fit the chart well, before I had them the full range and there was know reason why the stock would bottom in nomans land the outer Blue ones fit the set and confirm it by giving 161.8% at the 100% imo..
It would be intresting to see what Max thinks about that.
The 2 bottoms 05 & 08 have 2 bottoms so one would think Bottoms confirmed, its also full retracment from the last Head & Shoulders Pattern which there are 2 plus the ovbious Double Top, seems like everything comes in 2's ..lol
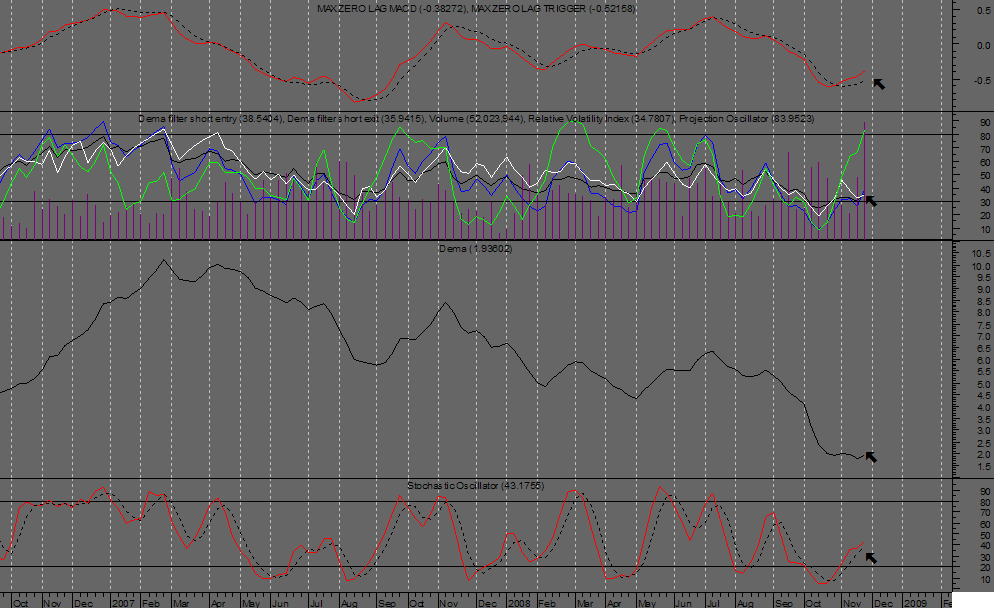
As you can see on the daily close up both the Stanndard Error Channels meet at this point,the greenlines are fib projections make of them what you will but they seem to give a clue, note 30d sma(Yellow) is on the up and the stock is now trading above it thats very good.
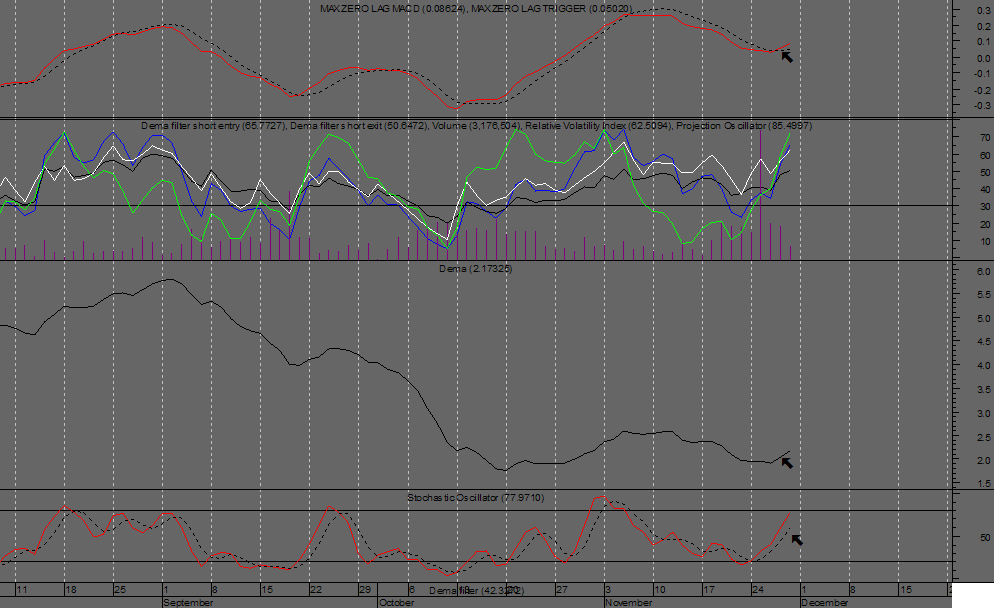
All Daily & Weekly inds are on the up including the Dema which is very good and LOW, Max Zero Lag has crossed as a buy on both as well.
I'd expect it to trade up to the 14d sma on the weekly chart fairly smartly, bearing in mind that may move down a tad and provided it gets over the Andrews Midline (daily chart).
Monthly Charts Candles are a Candle Tweezer Bottom as well, the Monthly Projection & RVI are on the turn to (see 2nd pannel inds GREEN / WHITE allways the first to go).
A bit more Daily Volume would help..imo
To round up at this point you have 2 of the 3 charts in your favor and the 3Rd about to turn and thats the first time since the start of 07 all 3 are lining up so it looks good for long term investors again, as well as traders..imo
Hope it helps.
Cheers Pete.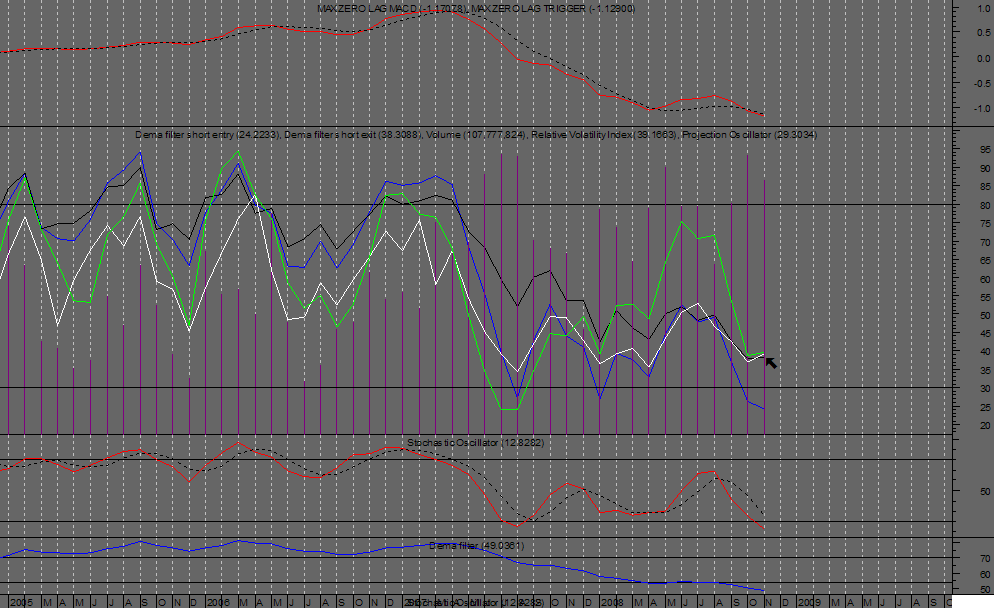
- Forums
- ASX - By Stock
- PDN
- chart for westie
chart for westie
-
- There are more pages in this discussion • 29 more messages in this thread...
You’re viewing a single post only. To view the entire thread just sign in or Join Now (FREE)
Featured News
Add PDN (ASX) to my watchlist
 (20min delay) (20min delay)
|
|||||
|
Last
$14.12 |
Change
0.950(7.21%) |
Mkt cap ! $4.221B | |||
| Open | High | Low | Value | Volume |
| $13.93 | $14.28 | $13.83 | $28.97M | 2.056M |
Buyers (Bids)
| No. | Vol. | Price($) |
|---|---|---|
| 24 | 1987 | $14.12 |
Sellers (Offers)
| Price($) | Vol. | No. |
|---|---|---|
| $14.13 | 3896 | 43 |
View Market Depth
| No. | Vol. | Price($) |
|---|---|---|
| 25 | 1988 | 14.120 |
| 23 | 5414 | 14.110 |
| 18 | 3820 | 14.100 |
| 17 | 4650 | 14.090 |
| 9 | 3563 | 14.080 |
| Price($) | Vol. | No. |
|---|---|---|
| 14.130 | 3858 | 44 |
| 14.140 | 3844 | 20 |
| 14.150 | 11773 | 27 |
| 14.160 | 4183 | 13 |
| 14.170 | 2773 | 9 |
| Last trade - 13.24pm 11/07/2024 (20 minute delay) ? |
Featured News
| PDN (ASX) Chart |
