Im no chartist, but here is my take..
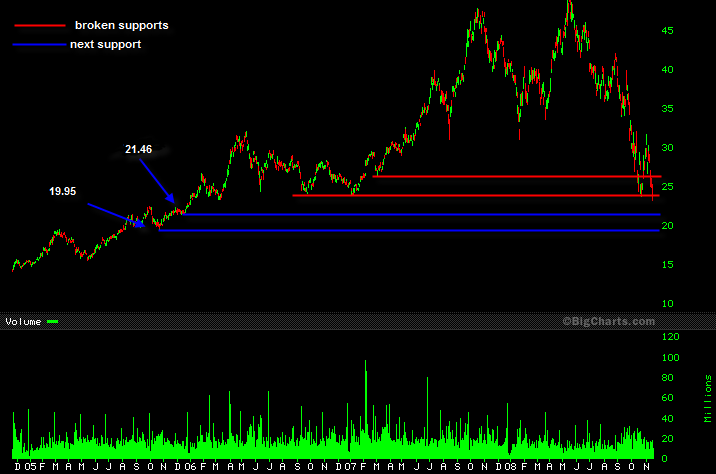
here is the chart I posted 2 days ago which shows the support @ around $23.00 broken.. I placed blue lines there to show where the next support levels were.. It seems that it did head through the next support level and down to the support level today @ $19.95 (well it hit $20.00), before staging a very nice rally to close at $21.90.
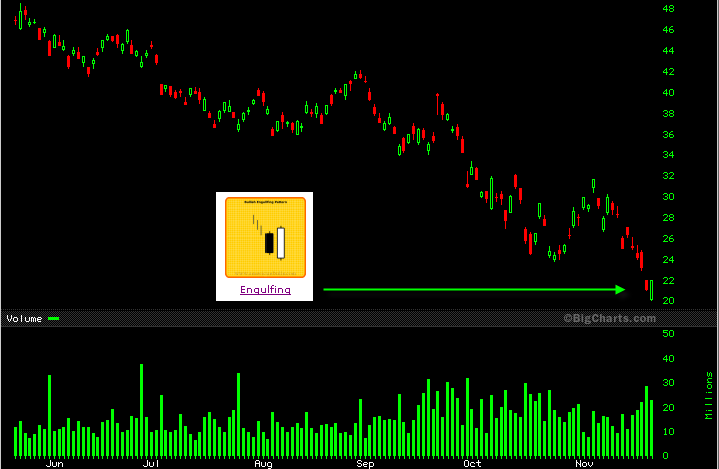
Here is the updated 6 month chart..
Definition:
Bullish Engulfing Pattern is a pattern characterized by a large white real body engulfing a preceding small black real body, which appears during a downtrend. The white body does not necessarily engulf the shadows of the black body but totally engulfs the body itself. The Bullish Engulfing Pattern is an important bottom reversal signal.
Recognition Criteria:
1. Market is characterized by downtrend.
2. Then we see a small black body.
3. Next day we see a white body that completely engulfs the black real body of the preceding day.
Explanation:
While the market sentiment is bearish; we see some subsided selling reflected by the short, black real body of the first day. Next day shows bull strength with a closing price at or above the previous day’s open. It means that the downtrend is now losing momentum and the bulls started to take the lead.
chart interpretation after today.


Add BHP (ASX) to my watchlist
 (20min delay) (20min delay)
|
|||||
|
Last
$43.56 |
Change
0.390(0.90%) |
Mkt cap ! $220.9B | |||
| Open | High | Low | Value | Volume |
| $43.64 | $43.73 | $43.26 | $211.2M | 4.849M |
Buyers (Bids)
| No. | Vol. | Price($) |
|---|---|---|
| 2 | 11133 | $43.55 |
Sellers (Offers)
| Price($) | Vol. | No. |
|---|---|---|
| $43.57 | 5435 | 3 |
View Market Depth
| Last trade - 16.10pm 11/07/2024 (20 minute delay) ? |
| BHP (ASX) Chart |