Hi Guys
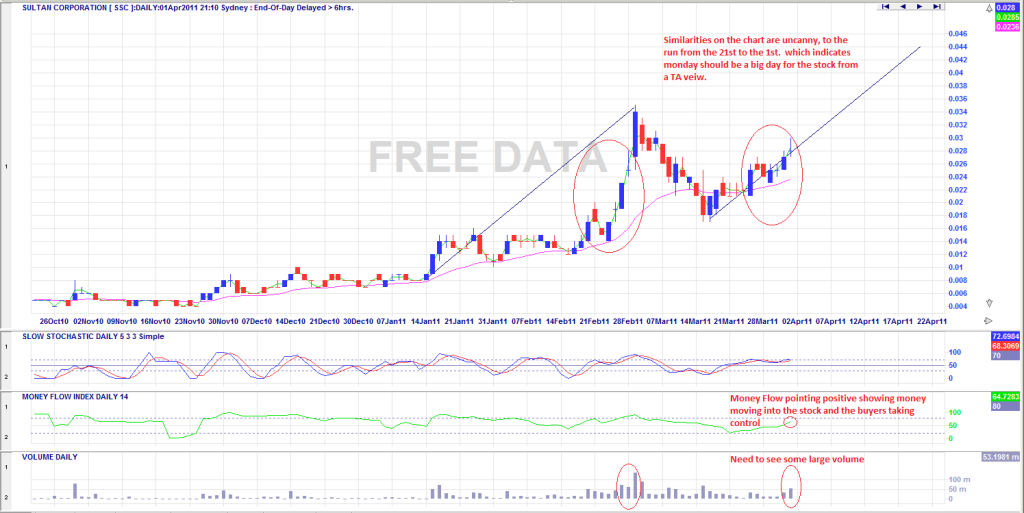
Thought i would post up a chart of the recent trading due to the similarities in last weeks candle formations to that of the last run to the new high. I have attached a copy below and as you can see the similarities between the two are extrodinary. Looking at these formations i beleive we will have a break out above the 3c level provided the money flow index is still strong and we have some large volume.
This could be acheived on the TA alone if we get one of the long awaited announcements then we could see the share price break and test new highs, provided it is a positive announcement. GL to all holders
GB
Add to My Watchlist
What is My Watchlist?


