Evening all.
Just looking at BLR from a technical perspective.
Stochastics have rolled up on the daily and the macd has bounced off itself when it looked like it was going to cross down. I see that as a great bullish sign.
Price wise next resistance is 4.4c, followed by 5.8c.
On a bigger time frame (which i havent shown on this chart) the fibonacci levels from the 34.5c high to its recent 1.1c low, indicate that 9c is the 23.6 retracement.
This is shown as the dotted blue line on the chart.
I suspect this will be retested eventually.
Be aware I hold the stock, and trade it when i can.
Chart looks like this.
Cheers
Commy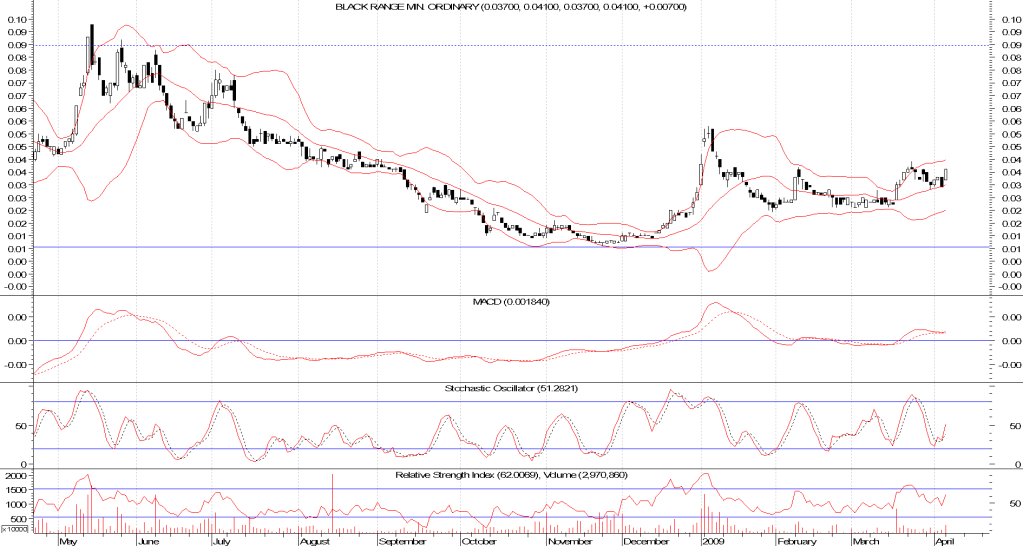
Evening all.Just looking at BLR from a technical...


Featured News
Add BLR (ASX) to my watchlist
Currently unlisted public company.
The Watchlist
FHE
FRONTIER ENERGY LIMITED
Adam Kiley, CEO
Adam Kiley
CEO
SPONSORED BY The Market Online