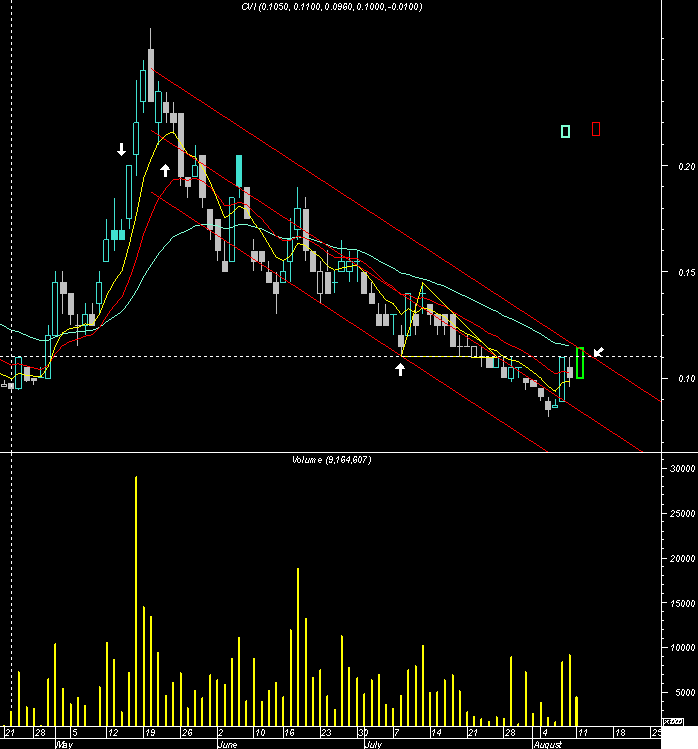
Back to the old chart when 11c was the descending triangle support base.
11c is now resistance.
Just a kiss chart showing the 7.14 and 30 EMA's and current standard error channel attempting a breakout, as mentioned elsewhere, insufficient accumulation and momentum for this just yet.
Bugga the intraday bigcharts have just gone down
perhaps worth checking back on for momentum detail
chart thread only please
-
- There are more pages in this discussion • 38 more messages in this thread...


You’re viewing a single post only. To view the entire thread just sign in or Join Now (FREE)