Hi all,
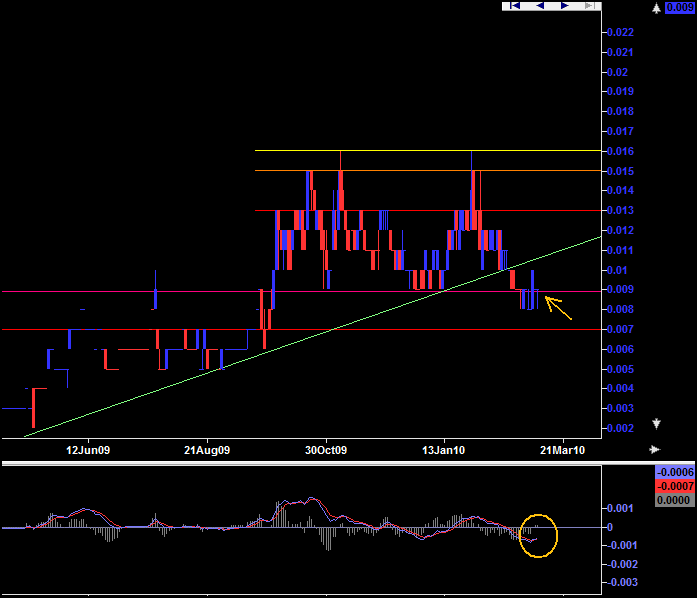
Just having a refresher glimpse here to see how we are tracking. Clearly, we broke below the ascending support line (green line) not too long ago. However, the downward pressure wasn't very strong, hence we're looking at a situation where price looks to be rebounding again. Our current support appears to be around 0.9c (arrow), with a technical resistance around 1.1c (again, green line). If you're a technical indicator buff, you would have noticed a positive MACD cross-over occurring. If we get some momentum (eg. positive news) soon, we might see some of those upper resistance points challenged again...here's watchin'!! ;-)
cheers
S

- Forums
- ASX - By Stock
- ASE
- chart update - looking bullish
ASE
astute metals nl
Add to My Watchlist
6.67%
 !
1.4¢
chart update - looking bullish
-
- There are more pages in this discussion • 2 more messages in this thread...
You’re viewing a single post only. To view the entire thread just sign in or Join Now (FREE)
Add to My Watchlist
What is My Watchlist?
A personalised tool to help users track selected stocks. Delivering real-time notifications on price updates, announcements, and performance stats on each to help make informed investment decisions.
 (20min delay) (20min delay)
|
|||||
|
Last
1.4¢ |
Change
-0.001(6.67%) |
Mkt cap ! $8.654M | |||
| Open | High | Low | Value | Volume |
| 1.4¢ | 1.4¢ | 1.4¢ | $840 | 60K |
Buyers (Bids)
| No. | Vol. | Price($) |
|---|---|---|
| 10 | 2470714 | 1.4¢ |
Sellers (Offers)
| Price($) | Vol. | No. |
|---|---|---|
| 1.5¢ | 2965350 | 2 |
View Market Depth
| No. | Vol. | Price($) |
|---|---|---|
| 10 | 2470714 | 0.014 |
| 5 | 667000 | 0.013 |
| 7 | 726380 | 0.012 |
| 4 | 740810 | 0.011 |
| 7 | 2298707 | 0.010 |
| Price($) | Vol. | No. |
|---|---|---|
| 0.015 | 2929565 | 1 |
| 0.016 | 1673372 | 2 |
| 0.017 | 1331970 | 5 |
| 0.018 | 1166027 | 3 |
| 0.019 | 1000666 | 4 |
| Last trade - 15.55pm 08/08/2025 (20 minute delay) ? |
| ASE (ASX) Chart |


