My mate bobcock rang me this morning for a chart.
After looking at monthly, weekly and daily charts I told him it was all looking good, very bullish
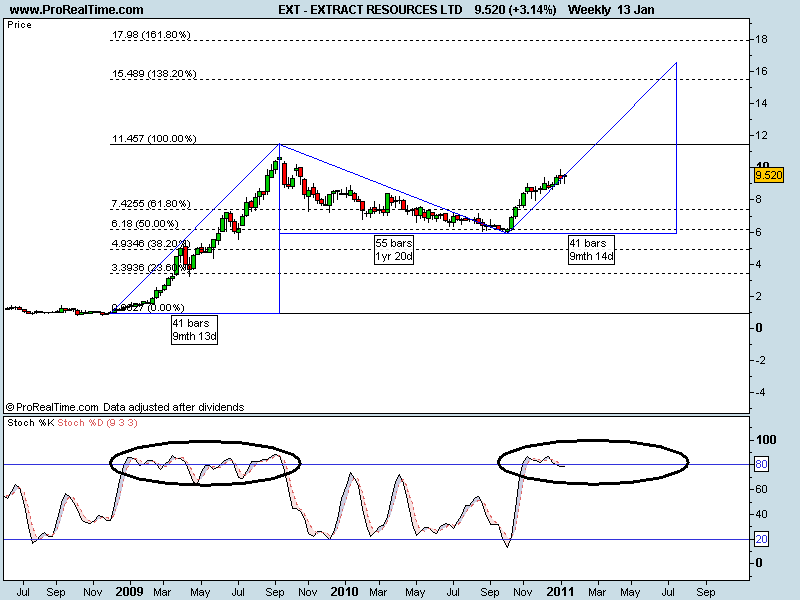
The most interesting thing I found was on the weekly chart below.
The last time the stochastic went so high it stayed there for a 41 week rally.
There is a possibility that you could see a repeat of that; patterns often repeat.
So technically, $15 later in the year is a possibility and it would coincide with the 138% fib level.
The uptrend saw a slow and steady 55 week consolidation/pullback, a healthy and necessary thing to go forward again.
Anything can happen, this is only one possibility.
The biggest test of this stocks strength will be whether is can break the high at the $11.50 area.
THAT will be the make or break.
- Forums
- ASX - By Stock
- EXT
- chart update?
EXT
excite technology services ltd
Add to My Watchlist
20.0%
 !
0.8¢
chart update?, page-2
Featured News
Add to My Watchlist
What is My Watchlist?
A personalised tool to help users track selected stocks. Delivering real-time notifications on price updates, announcements, and performance stats on each to help make informed investment decisions.
 (20min delay) (20min delay)
|
|||||
|
Last
0.8¢ |
Change
-0.002(20.0%) |
Mkt cap ! $16.58M | |||
| Open | High | Low | Value | Volume |
| 0.9¢ | 0.9¢ | 0.8¢ | $24.16K | 2.685M |
Buyers (Bids)
| No. | Vol. | Price($) |
|---|---|---|
| 4 | 2745670 | 0.8¢ |
Sellers (Offers)
| Price($) | Vol. | No. |
|---|---|---|
| 0.9¢ | 4498266 | 2 |
View Market Depth
| No. | Vol. | Price($) |
|---|---|---|
| 3 | 1494545 | 0.008 |
| 6 | 2508700 | 0.007 |
| 3 | 1350000 | 0.006 |
| 2 | 1280000 | 0.005 |
| 2 | 1498000 | 0.004 |
| Price($) | Vol. | No. |
|---|---|---|
| 0.009 | 4498266 | 2 |
| 0.010 | 2793222 | 3 |
| 0.011 | 4055590 | 7 |
| 0.012 | 1482124 | 5 |
| 0.013 | 53000 | 1 |
| Last trade - 15.47pm 20/06/2025 (20 minute delay) ? |
Featured News
| EXT (ASX) Chart |


