Morning all.
Just looking at a heap of blue chip stock charts over a coffee while my family seeps.
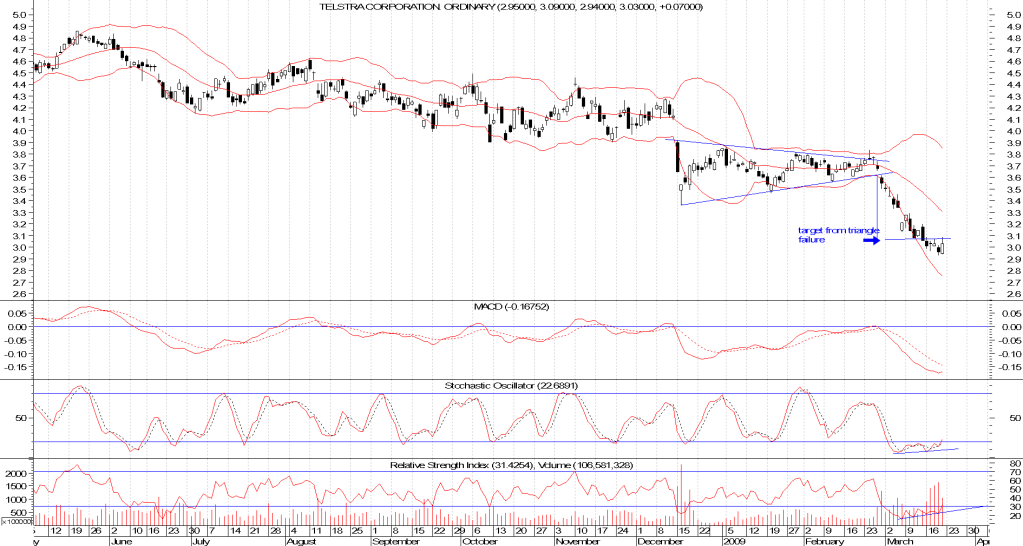
Telstra chart has some bullish technicals.
I will add I have NOT got any grasp on the fundamentals with this company, so be aware I am only commenting fom a charting perspective.
Telstra has been sold down heavily over the past month.
But I think that a bounce is coming and may be worth watching out for.
There is some bullish divergence between price and RSI and the daily MACD is starting to turn up - but it has not crossed as yet.
I had an initial bottom price target of 2-89 based on fibonacci, but it missed by 4c on thursday.
I do not hold but am watching TLS for signs of a rally from now, a fall back to 2-89 followed by a prompt reversal would be ideal for me......but may be wishful thinking.
Good luck, DYOR.
Cheers
Commy
chart warming up for a bounce


Add TLS (ASX) to my watchlist
 (20min delay) (20min delay)
|
|||||
|
Last
$3.96 |
Change
0.000(0.00%) |
Mkt cap ! $45.75B | |||
| Open | High | Low | Value | Volume |
| $3.97 | $3.98 | $3.92 | $116.3M | 29.42M |
Buyers (Bids)
| No. | Vol. | Price($) |
|---|---|---|
| 1 | 20000 | $3.95 |
Sellers (Offers)
| Price($) | Vol. | No. |
|---|---|---|
| $3.97 | 830574 | 28 |
View Market Depth
| Last trade - 16.10pm 13/09/2024 (20 minute delay) ? |
| TLS (ASX) Chart |