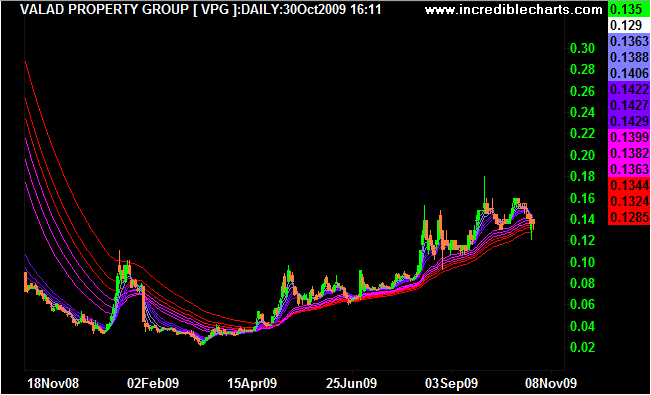
Below you will see a chart of VPG that uses 12 EMA's.
6 are short term (purple lines) and the others are long term averages (red lines)
The Short term group represent the noisy element of the security and the Longer, Smoother groups represent the filtered out noise.
One can see that the Longer smoother group of averages dictate the character and strength of the trend. In most cases, in an uptrend, the stock will generally "bounce" of the smoother averages. The wider apart the averages are the stronger the trend.
Add to My Watchlist
What is My Watchlist?


