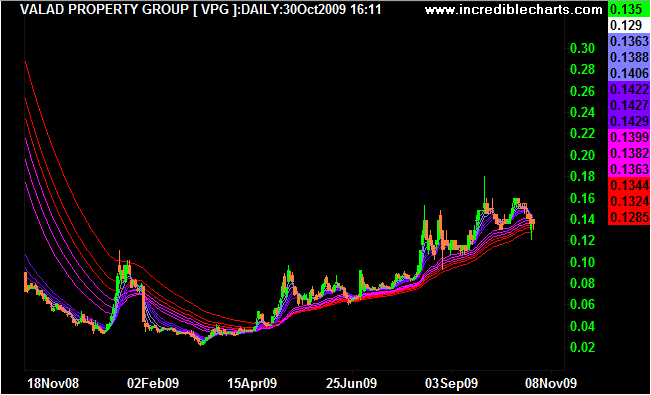
Below you will see a chart of VPG that uses 12 EMA's.
6 are short term (purple lines) and the others are long term averages (red lines)
The Short term group represent the noisy element of the security and the Longer, Smoother groups represent the filtered out noise.
One can see that the Longer smoother group of averages dictate the character and strength of the trend. In most cases, in an uptrend, the stock will generally "bounce" of the smoother averages. The wider apart the averages are the stronger the trend.
- Forums
- ASX - By Stock
- chart
Below you will see a chart of VPG that uses 12 EMA's.6 are short...
-
- There are more pages in this discussion • 14 more messages in this thread...
You’re viewing a single post only. To view the entire thread just sign in or Join Now (FREE)
Featured News
Add VPG (ASX) to my watchlist
 (20min delay) (20min delay)
|
|||||
|
Last
$1.79 |
Change
0.000(0.00%) |
Mkt cap ! n/a | |||
| Open | High | Low | Value | Volume |
| 0.0¢ | 0.0¢ | 0.0¢ | $0 | 0 |
Featured News
The Watchlist
3DA
AMAERO INTERNATIONAL LTD
Hank Holland, Executive Chairman and CEO
Hank Holland
Executive Chairman and CEO
Previous Video
Next Video
SPONSORED BY The Market Online


